Which graph in the following figure best represents the variation of velocity with time of a ball which bounces vertically on a hard surface, from the moment when it rebounds from the surface ?
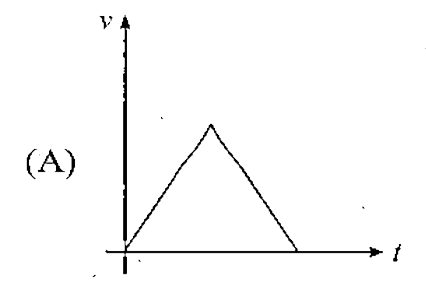
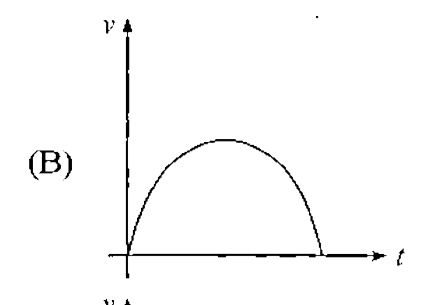
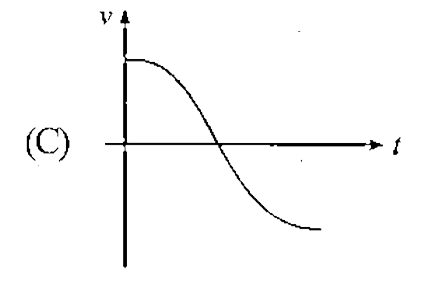
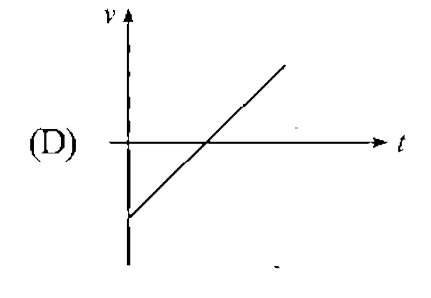
The correct Answer is:D
Step by step video, text & image solution for Which graph in the following figure best represents the variation of velocity with time of a ball which bounces vertically on a hard surface, from the moment when it rebounds from the surface ? by Physics experts to help you in doubts & scoring excellent marks in Class 11 exams.
Updated on:21/07/2023Topper's Solved these Questions
Similar Questions
Knowledge Check
Which of the following graphs best represents the variation of acceleration 'a' with displacement x?
A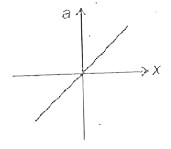 B
B C
C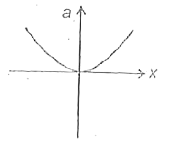 D
D
Which of the following graphs represents the variation of activity (A) of a radioactive substance with time (t).
A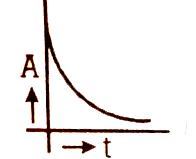 B
B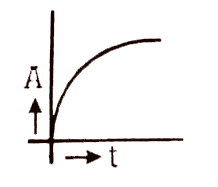 C
C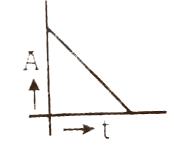 D
D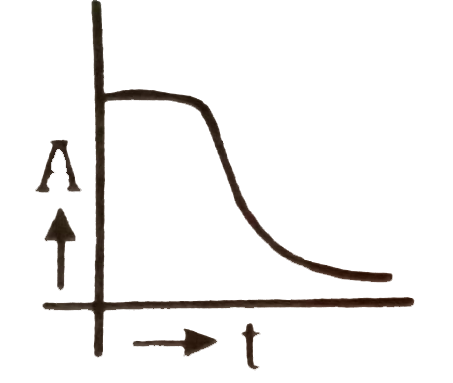
Which one of the following graphs represents the variation of surface tension of water with temperture for a small range of temperature ?
A B
B C
C D
D
Which of the following x-t graphs represents the distance-time variation of a body released from the top of a buiding?
View SolutionWhich graph best represents the variation of radius r of a circular orbit of a satellite against its time priod T ?
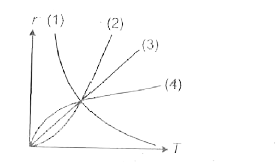
View SolutionWhich graph best represents the variation of electric potential as a function of distance from the centre of a uniformly charged solid sphere of charge of radius R ?
View SolutionThe graph that represents variation of g with depth (d) from the surface of the earth is
View SolutionWhich of the following graphs depicts the variation of KE of a ball bouncing on a horizontal floor with height ? (Neglect air resistances)
View Solution
