Show the relationship between X and Y through a scattered diagram.

Step by step video & image solution for Show the relationship between X and Y through a scattered diagram. by Economics experts to help you in doubts & scoring excellent marks in Class 11 exams.
Updated on:21/07/2023Topper's Solved these Questions
Similar Questions
Knowledge Check
A geometric representation, showing the relationship between a whole and its part, is
APie chartBBar graphCPictographDHistogramA diagram that shows the relationship between two variables is called
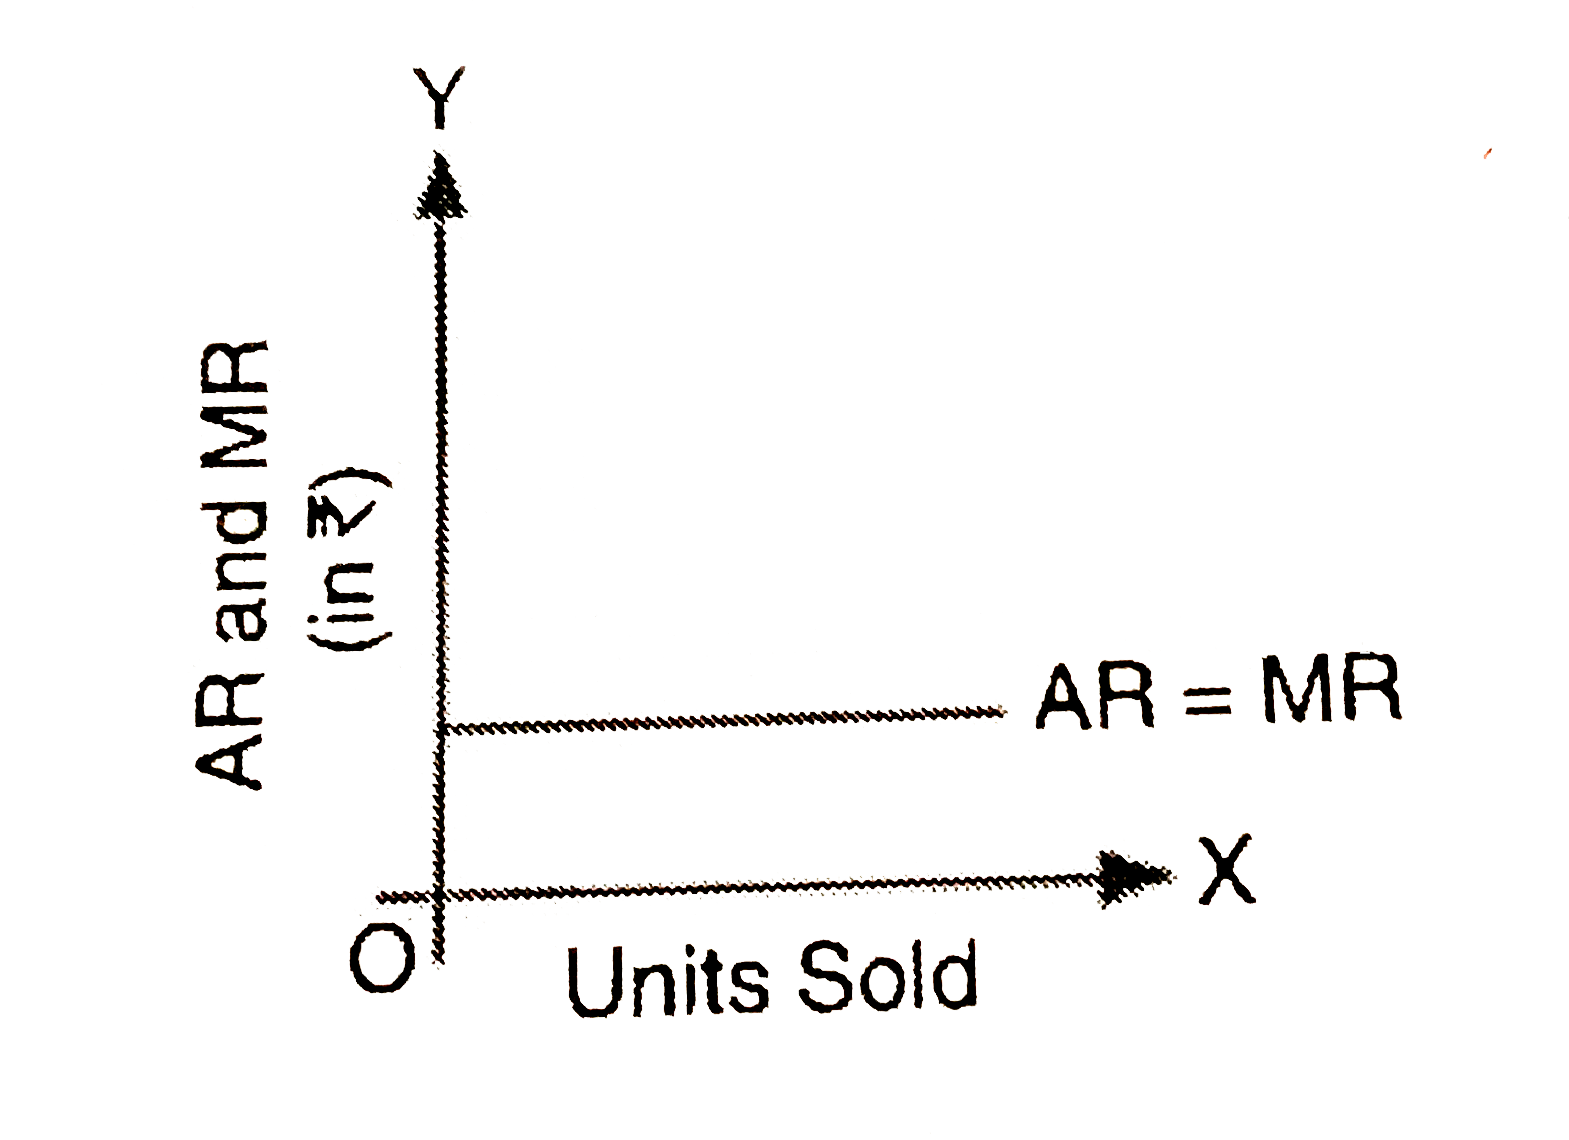
AMeanBScatter diagramCMapDMedianThe relationship between AR and MR depicted in the following diagram is possible when :
 APrice remains constant with rise in outputBPrice falls with rise in outputCPrice initially falls and then remains constant with rise in outputDNone of these
Discuss the relationship between TVC and MC.
OR
Draw a diagram showing TVC in terms of the area under MC curve.
View SolutionA geometric representation showing the relationship between a whole and its parts is a
View SolutionDraw a Venn diagram showing the relationship between Earth, our solar system, the galaxies, the Milky way, Ursa Major, Orion.
View SolutionShow the relationship between gross primary productivity and net primary productivity .
View SolutionWhat is the relationship between oxidation and oxidising agent in a redox reaction? Write an example of a redox reaction showing the relationship between oxidation and the oxidising agent.
View Solution


