Which of the following graphs represent the behaviour of an ideal gas ?
The correct Answer is:A
To determine which graph represents the behavior of an ideal gas, we can follow these steps:
Step 1: Understand the Ideal Gas Law
The ideal gas law is given by the equation:
pV=nRT
where:
- p = pressure
- V = volume
- n = number of moles of gas
- R = universal gas constant
- T = temperature
Step 2: Analyze the Relationships
From the ideal gas law, we can derive relationships between different variables:
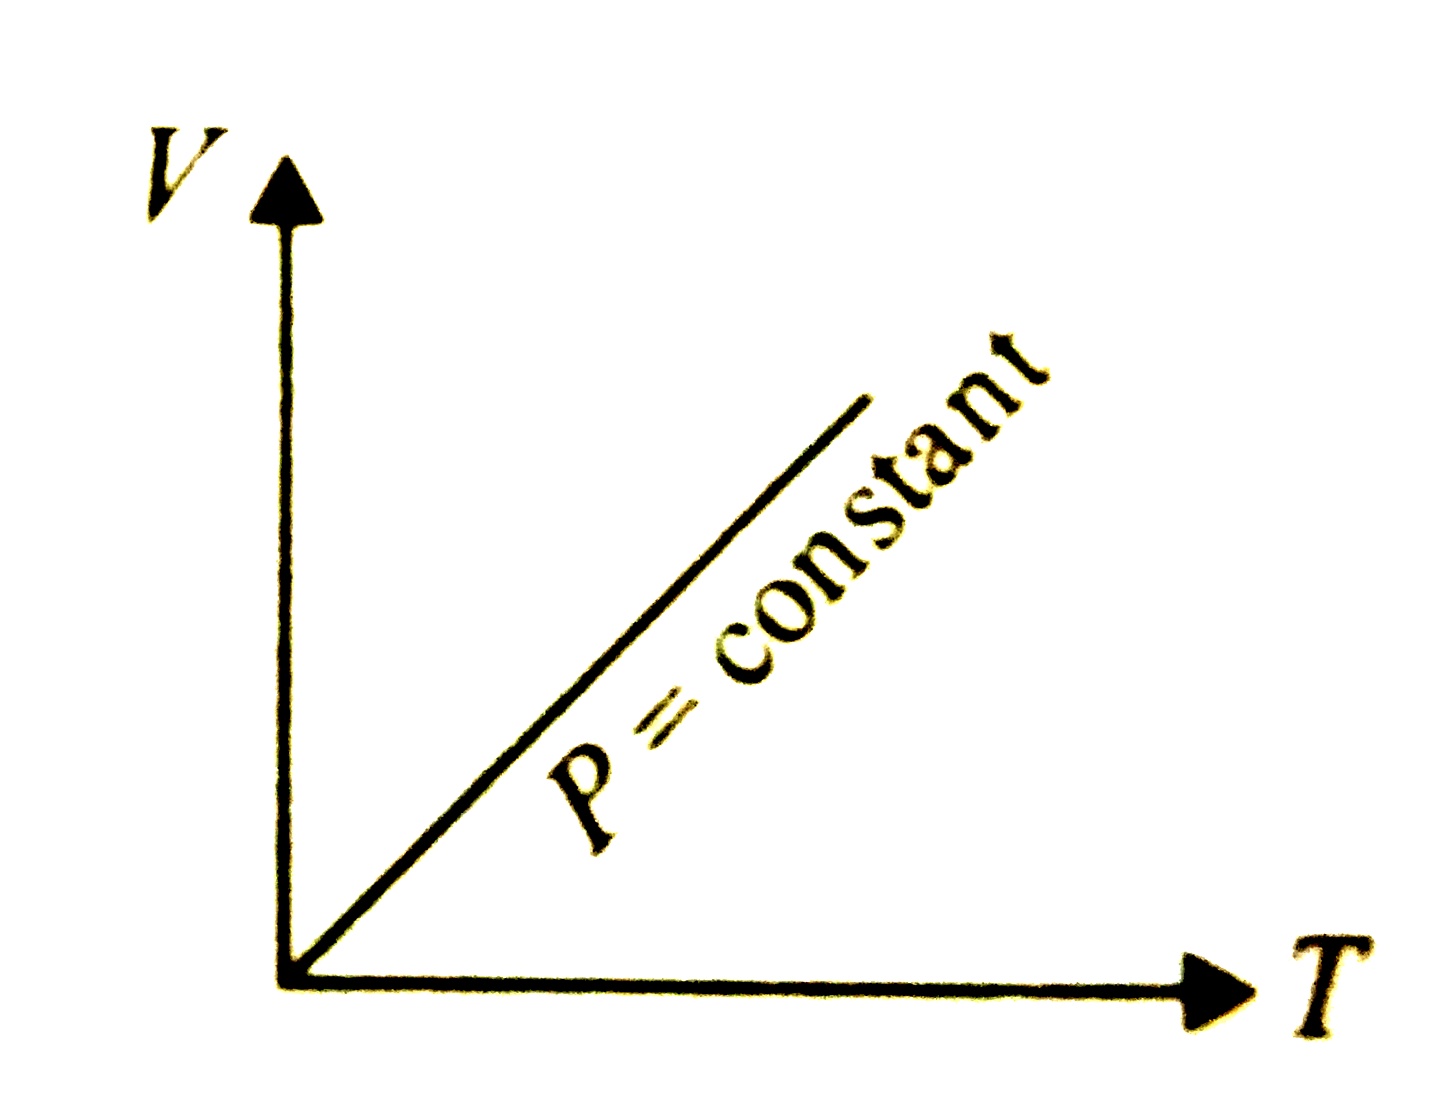
1. If pressure (p) is held constant, then volume (V) is directly proportional to temperature (T):
V∝T
This means that if we plot a graph of volume (y-axis) versus temperature (x-axis), we should see a straight line that slopes upwards.
Step 3: Evaluate the Given Graphs
Now, we need to evaluate the four graphs provided:
1. Graph 1: If this graph shows a straight line with volume on the y-axis and temperature on the x-axis, it represents the relationship V∝T at constant pressure. This graph is correct.
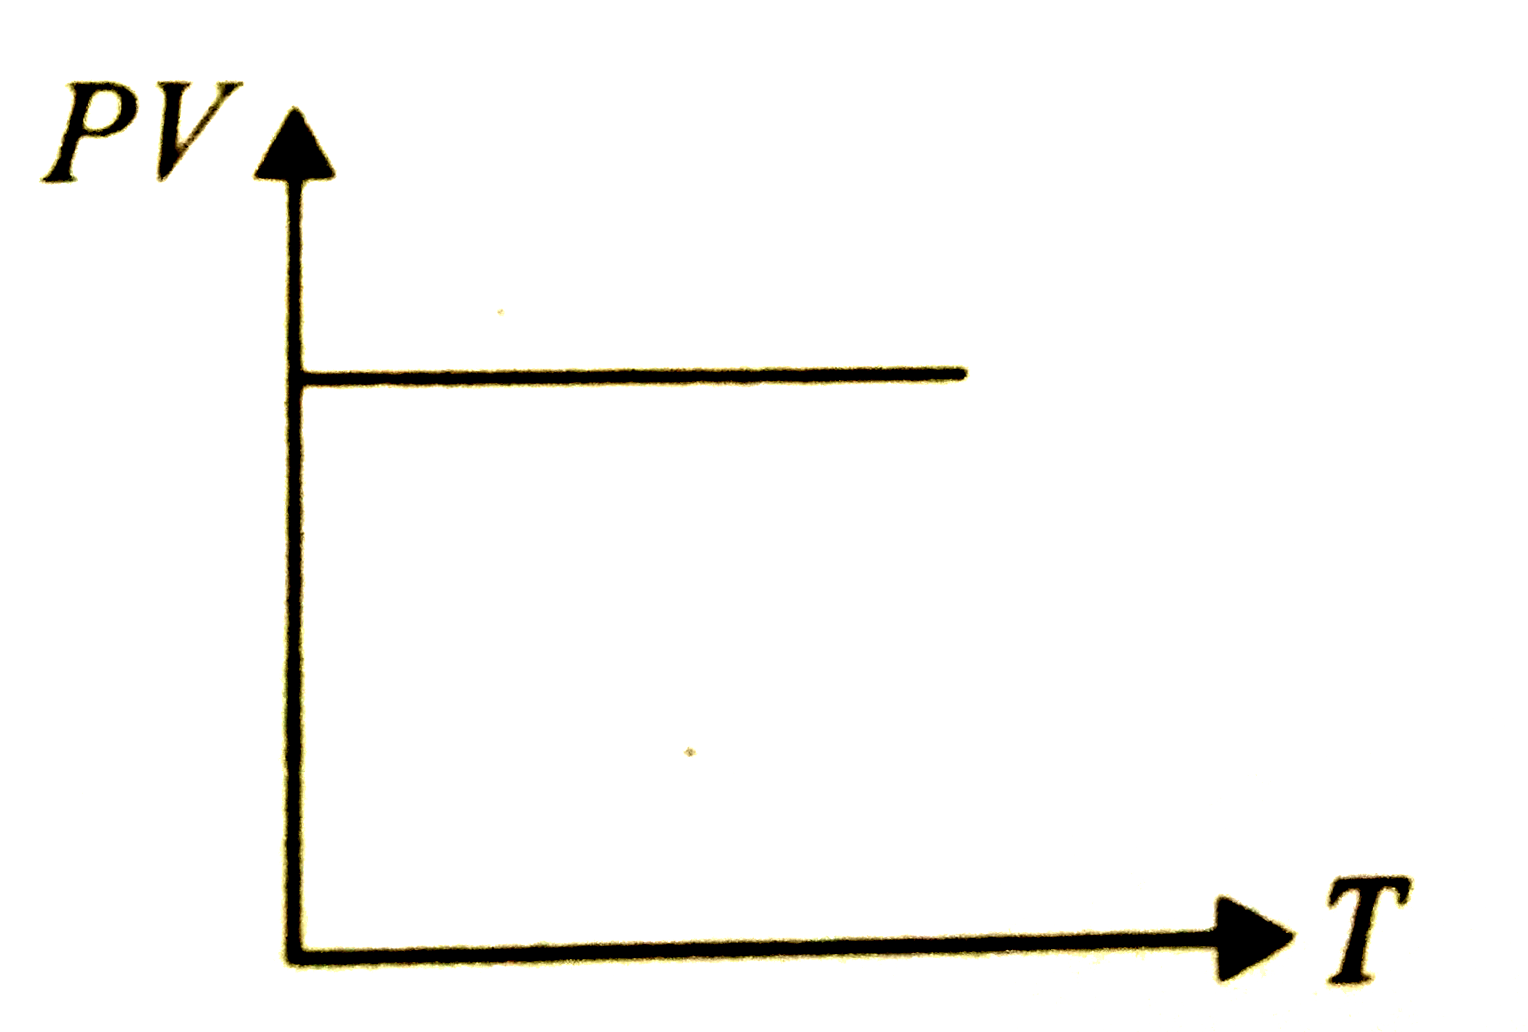
2. Graph 2: If this graph suggests that pV is dependent on T directly, it is incorrect because pV is equal to nRT and not dependent on T alone.
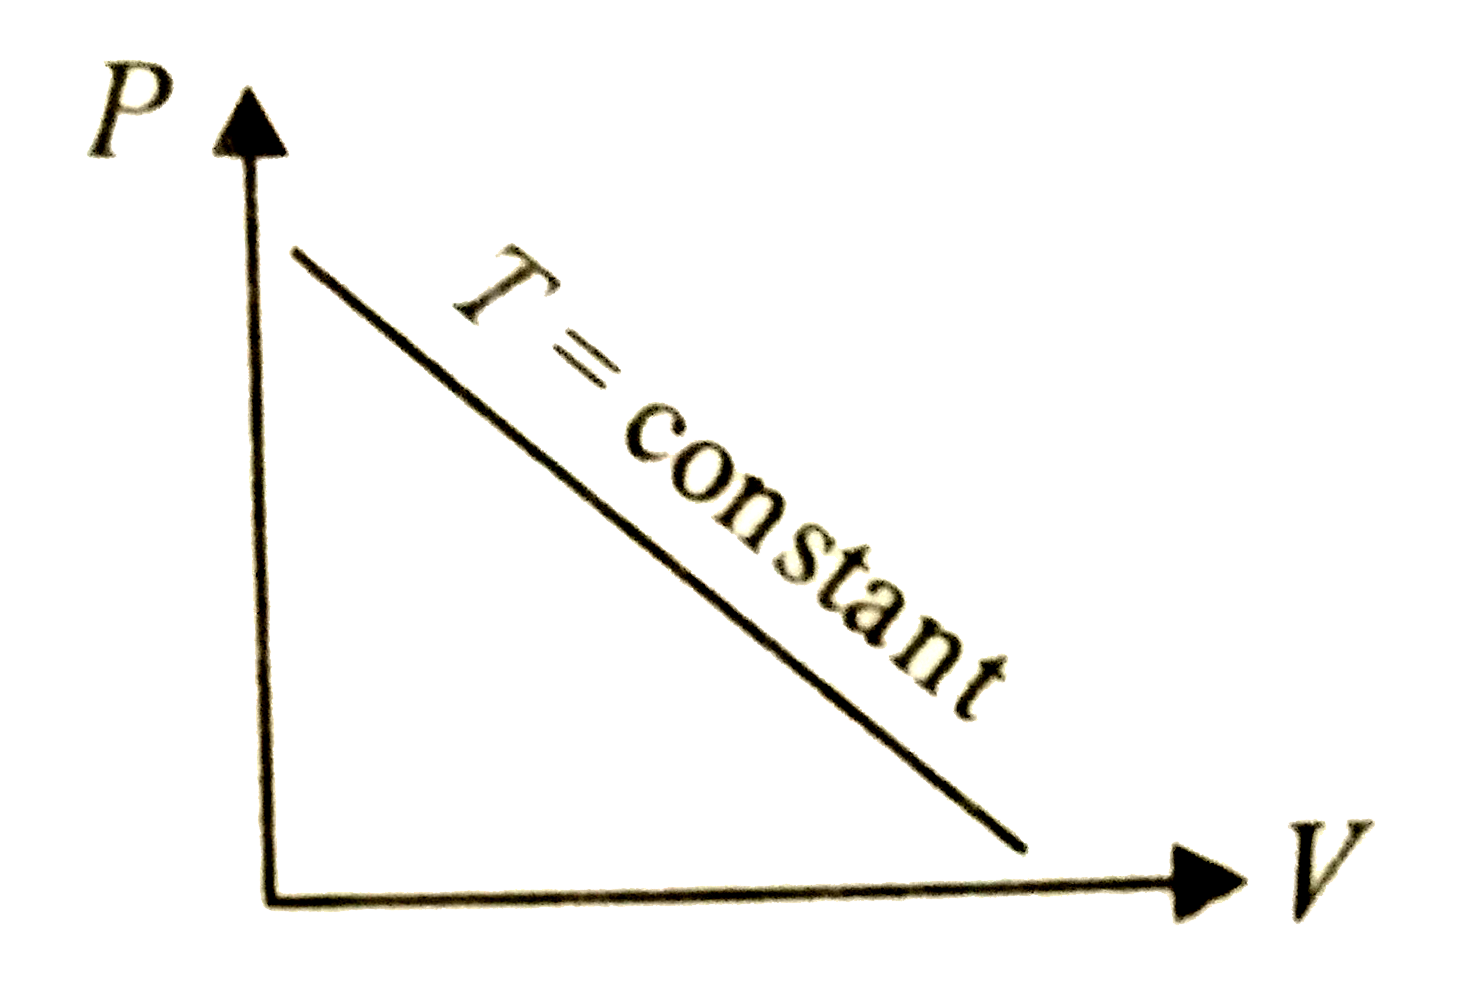
3. Graph 3: If this graph shows a linear decrease between pressure and volume, it is incorrect. According to Boyle's Law, pressure is inversely proportional to volume at constant temperature, which should yield a hyperbolic curve.
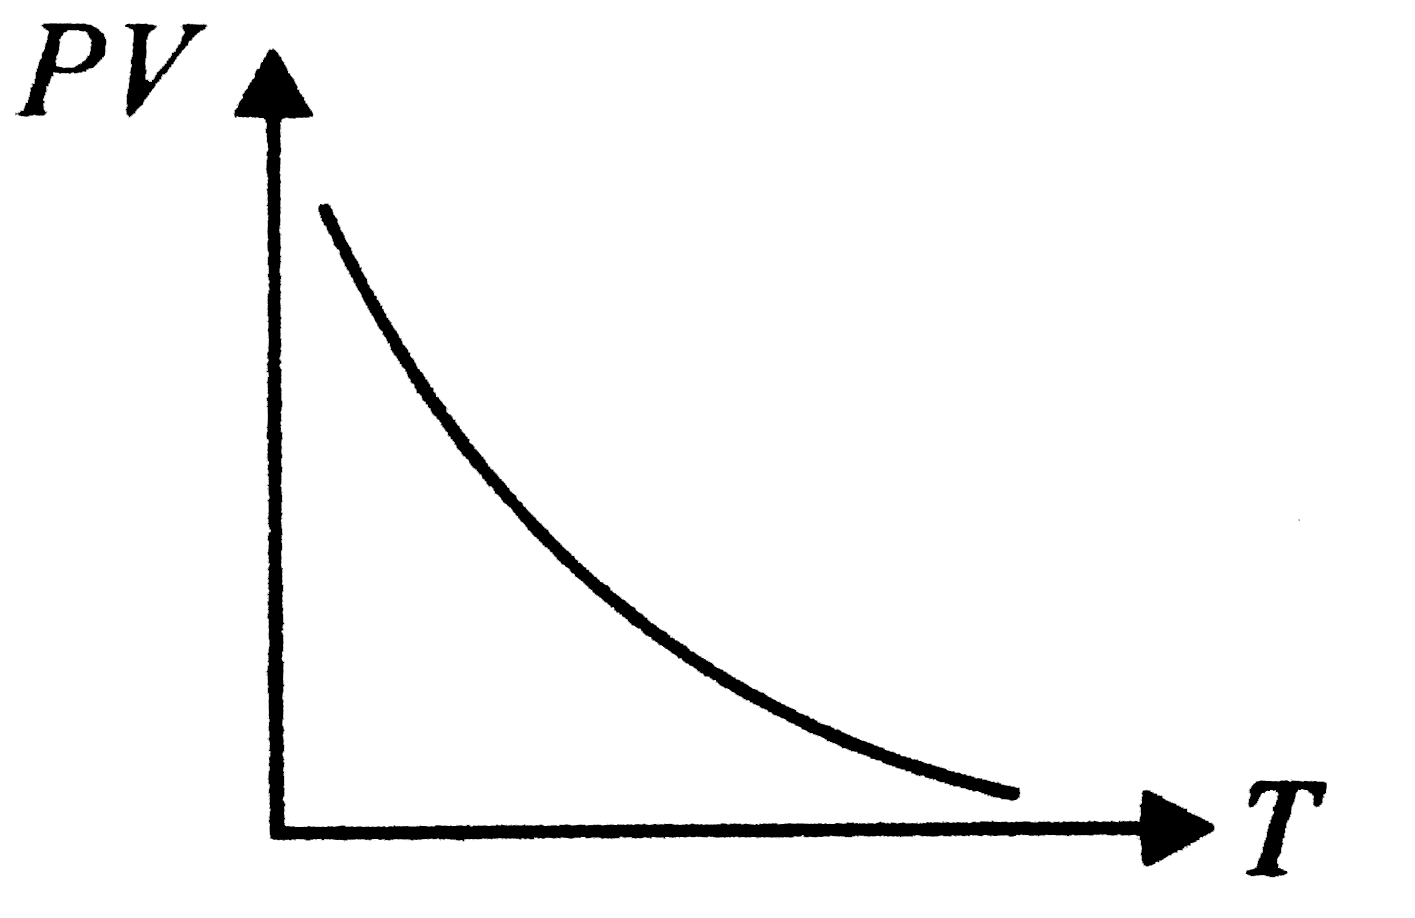
4. Graph 4: If this graph indicates that pV is dependent on T in a linear fashion, it is also incorrect since pV is equal to nRT and does not vary linearly with T.
Step 4: Conclusion
After evaluating all the graphs, we conclude that Graph 1 correctly represents the behavior of an ideal gas.
Final Answer
The correct graph that represents the behavior of an ideal gas is Graph 1.
---
The ideal gas law is given by the equation:
pV=nRT
where:
- p = pressure
- V = volume
- n = number of moles of gas
- R = universal gas constant
- T = temperature
From the ideal gas law, we can derive relationships between different variables:
1. If pressure (p) is held constant, then volume (V) is directly proportional to temperature (T):
V∝T
This means that if we plot a graph of volume (y-axis) versus temperature (x-axis), we should see a straight line that slopes upwards.
Now, we need to evaluate the four graphs provided:
1. Graph 1: If this graph shows a straight line with volume on the y-axis and temperature on the x-axis, it represents the relationship V∝T at constant pressure. This graph is correct.
2. Graph 2: If this graph suggests that pV is dependent on T directly, it is incorrect because pV is equal to nRT and not dependent on T alone.
3. Graph 3: If this graph shows a linear decrease between pressure and volume, it is incorrect. According to Boyle's Law, pressure is inversely proportional to volume at constant temperature, which should yield a hyperbolic curve.
4. Graph 4: If this graph indicates that pV is dependent on T in a linear fashion, it is also incorrect since pV is equal to nRT and does not vary linearly with T.
After evaluating all the graphs, we conclude that Graph 1 correctly represents the behavior of an ideal gas.
The correct graph that represents the behavior of an ideal gas is Graph 1.
Similar Questions
Knowledge Check
Which of the following plots represents the behavior of an ideal binary liquid solution ?
APlot of PtotalvsYA (mol-fraction of A in vapour phase) is linearBplote of PtotalvsYB is linearCPlote of 1/PtotalvsYA is linearDPlote of 1/PtotalvsYB is non-linearWhich of the following plots does not represent the behaviour of an ideal binary liquid solution?
APlot of pA versus xA (mole fraction of A in liquid phase) is linearBPlot of pB versus xB is linearCPlot of ptotal versus xA (or xB) is linearDPlot of ptotal versus xA is non-linearWhich of the following plots does not represent the behaviour of an ideal binary liquid solution of A and B?
APlot of PB versus XB is linear.BPlot of PA versus XA is linear.CPlot of PTotal Versus XAorXB is linear.DPlot of PTotal versus XA is non-linear.
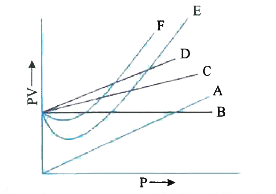
Which curve in the following graph represents the curve of ideal gas ?
View SolutionThe graph that does represent the behaviour of an ideal gas is :
View SolutionWhich of the following graphs is not a straight line for an ideal gas ?
View Solution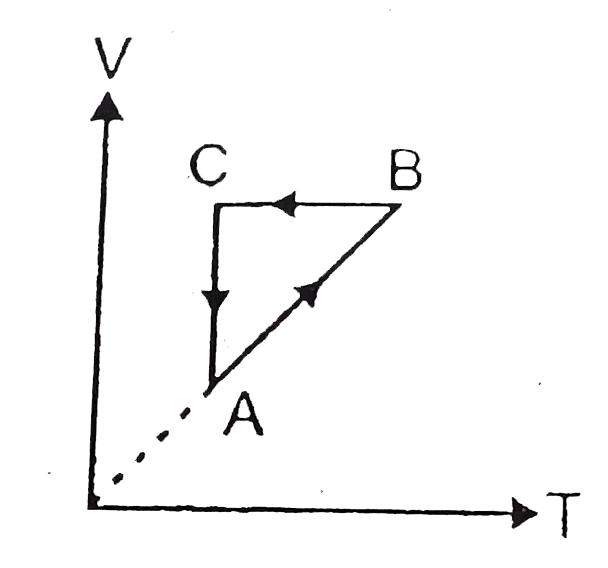
An ideal undergoes a thermodynamic cycle as shown in figure. Which of the following graphs represent the same cycle?
View SolutionThe graph that does not repersent the behaviour of an ideal gas is-
View Solution
