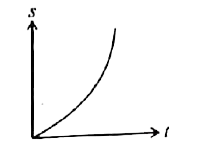
s-t graph shown in figure is a parabola. From this graph we find that :
 Solution in Tamil
the body is moving with uniform velocity
the body is moving with uniform speed
the body is starting from rest and moving with uniform acceleration
the body is not moving at all
The correct Answer is:C
Step by step video, text & image solution for s-t graph shown in figure is a parabola. From this graph we find that : by Physics experts to help you in doubts & scoring excellent marks in Class 11 exams.
Updated on:21/07/2023Similar Questions
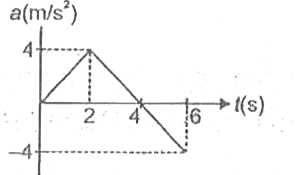
For the acceleration - time (a - t) graph shown in figure, the change in velocity of particle from t = 0 to t = 6 s is

View SolutionThe a -t graph is shown in the figure. The maximum velocity attained by the body from rest will be

View SolutionFor different values of L , we get different values of T^2 . The graph between L versus T^2 ia as shown in figure. Find the value of 'g' from the given graph.(Take (pi)^2= 10) . .
View SolutionFrom v-t graph shown in figure. We can draw the following conclusions
View SolutionAssertion : In the s-t graph as shown in figure, velocity of particle is negative and acceleration is positive. Reason : Slope of s-t graph is negative and increasing in magnitude.
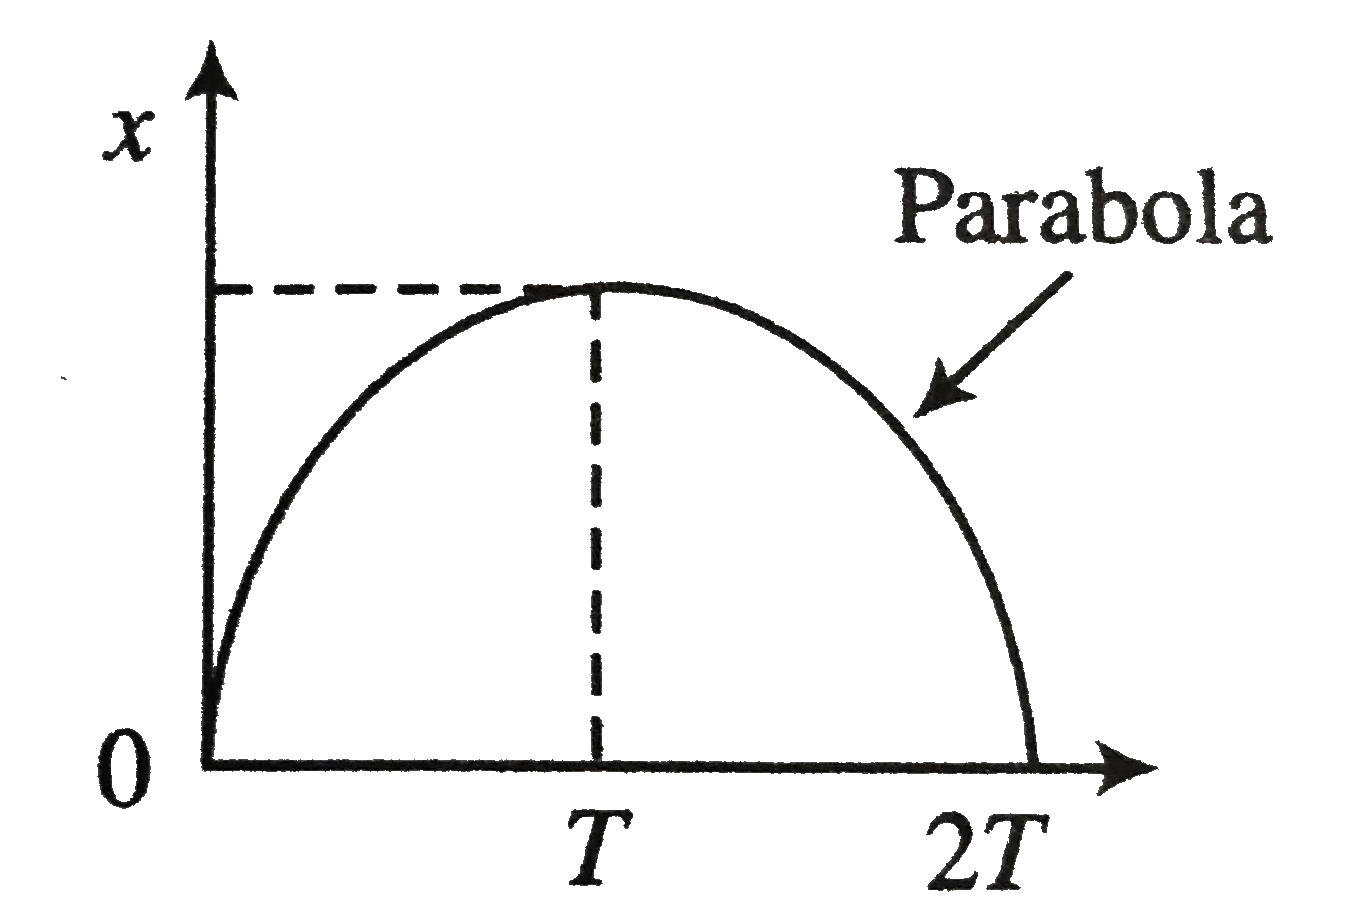
View SolutionThe x-t graph of a particle moving along a straight line is shown in figure

The v-t graph of the particle is correctly shown by
View SolutionThe x-t graph of a particle moving along a straight line is shown in figure

The a-t graph of the particle is correctly shown by
View Solution

