The diagram in Fig. shows the displacement time graph of a vibrating body.
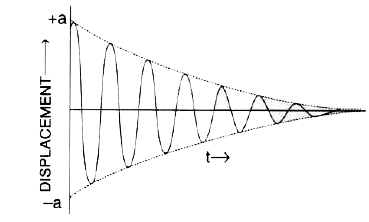
Give one example of such vibrations.
Step by step video solution for The diagram in Fig. shows the displacement time graph of a vibrating body. Give one example of such vibrations. by Physics experts to help you in doubts & scoring excellent marks in Class 10 exams.
Updated on:21/07/2023Topper's Solved these Questions
- SOUNDBook:ICSEChapter:SOUNDExercise:EXERCISE -7(B)( MULTIPLE CHOICE TYPE)
Explore 2 Videos
- SOUNDBook:ICSEChapter:SOUNDExercise:EXERCISE -7(C )
Explore 47 Videos
- SOUNDBook:ICSEChapter:SOUNDExercise:EXERCISE -7(A) (NUMERICALS )
Explore 14 Videos
- SIMPLE MACHINES Book:ICSEChapter:SIMPLE MACHINES Exercise:DIAGRAM BASED MCQ
Explore 5 Videos
- SPECIMEN PAPER (SOLVED)Book:ICSEChapter:SPECIMEN PAPER (SOLVED)Exercise:SECTION II
Explore 78 Videos
Similar Questions
What are the frequencies heard when a stretched wire is plucked in the middle ?
View SolutionState three characteristics of musical sound.
View SolutionThe wavelength of waves produced on the surface of water is 20 cm. If the wave velocity is 24 ms−1, calculate
The number of waves produced in one second and
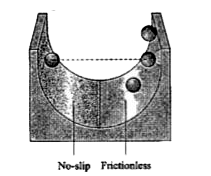
View SolutionState the efficiency of the following system as shown in the figure:
View SolutionThe diagram alongside shows a uniform metre rule of weight 100 gf being balanced on a knife edge placed at the 40 cm mark, by suspending a weight w gf at the mark 20 cm, find:

the value of w.
View Solutionआरेख की सहायता से अवमंदित कम्पन को समझाइये । अवमंदित कम्पन के दो उदाहरण दीजिये ।
View SolutionTime period of a body vibrating in S.H.M. is _____ of it's displacement.
View SolutionFig. 2.41 (a) shows the velocity-time graph for the motion of a body. Use it to find the displacement of the body at t = 1 s, 2 s, 3 s and 4 s, then draw the displacement-time graph for it on Fig. 2.41 (b).
View SolutionThe diagram below shows the displacement-time graph for a vibrating body.
Name the type of vibrations produced by the vibrating body.
View SolutionThe diagram in Fig. shows the displacement time graph of a vibrating body.

Give one example of such vibrations.
View SolutionThe diagram in Fig. shows the displacement time graph of a vibrating body.
Why is the amplitude of vibrations gradually decreasing ?
View SolutionThe diagram in Fig. shows the displacement time graph of a vibrating body.
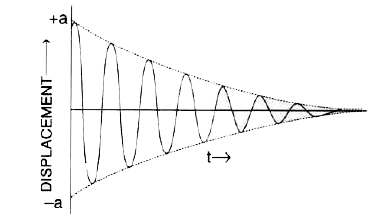
What happens to the vibrations of the body after some time?
View SolutionDraw a graph between displacement from mean position and time for a body executing free vibration in a vacuum.
View SolutionGive one example of forced vibration.
View SolutionWhat do you understand by natural vibrations of a body? Give one example.
View Solution