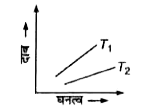
The following graph respresent the pressure versus number density for ideal gas at two different temperature T1andT2. The graph implies ................. .Solution in Tamil
T1=T2
T1>T2
T1<T2
connot be determined
The correct Answer is:B
Step by step video, text & image solution for The following graph respresent the pressure versus number density for ideal gas at two different temperature T_(1) and T_(2). The graph implies ................. . by Physics experts to help you in doubts & scoring excellent marks in Class 11 exams.
Updated on:21/07/2023Similar Questions
At two different temperature T_(1) and T_(2), (T_(2) gt T_(1)) , draw two PV-P graphs for a definite amount of an ideal gas.
View SolutionThe stress-strain graph for a metallic wire is shown at two different temperature, T_(1) and T_(2) which temperature is high T_(1) or T_(2) ?
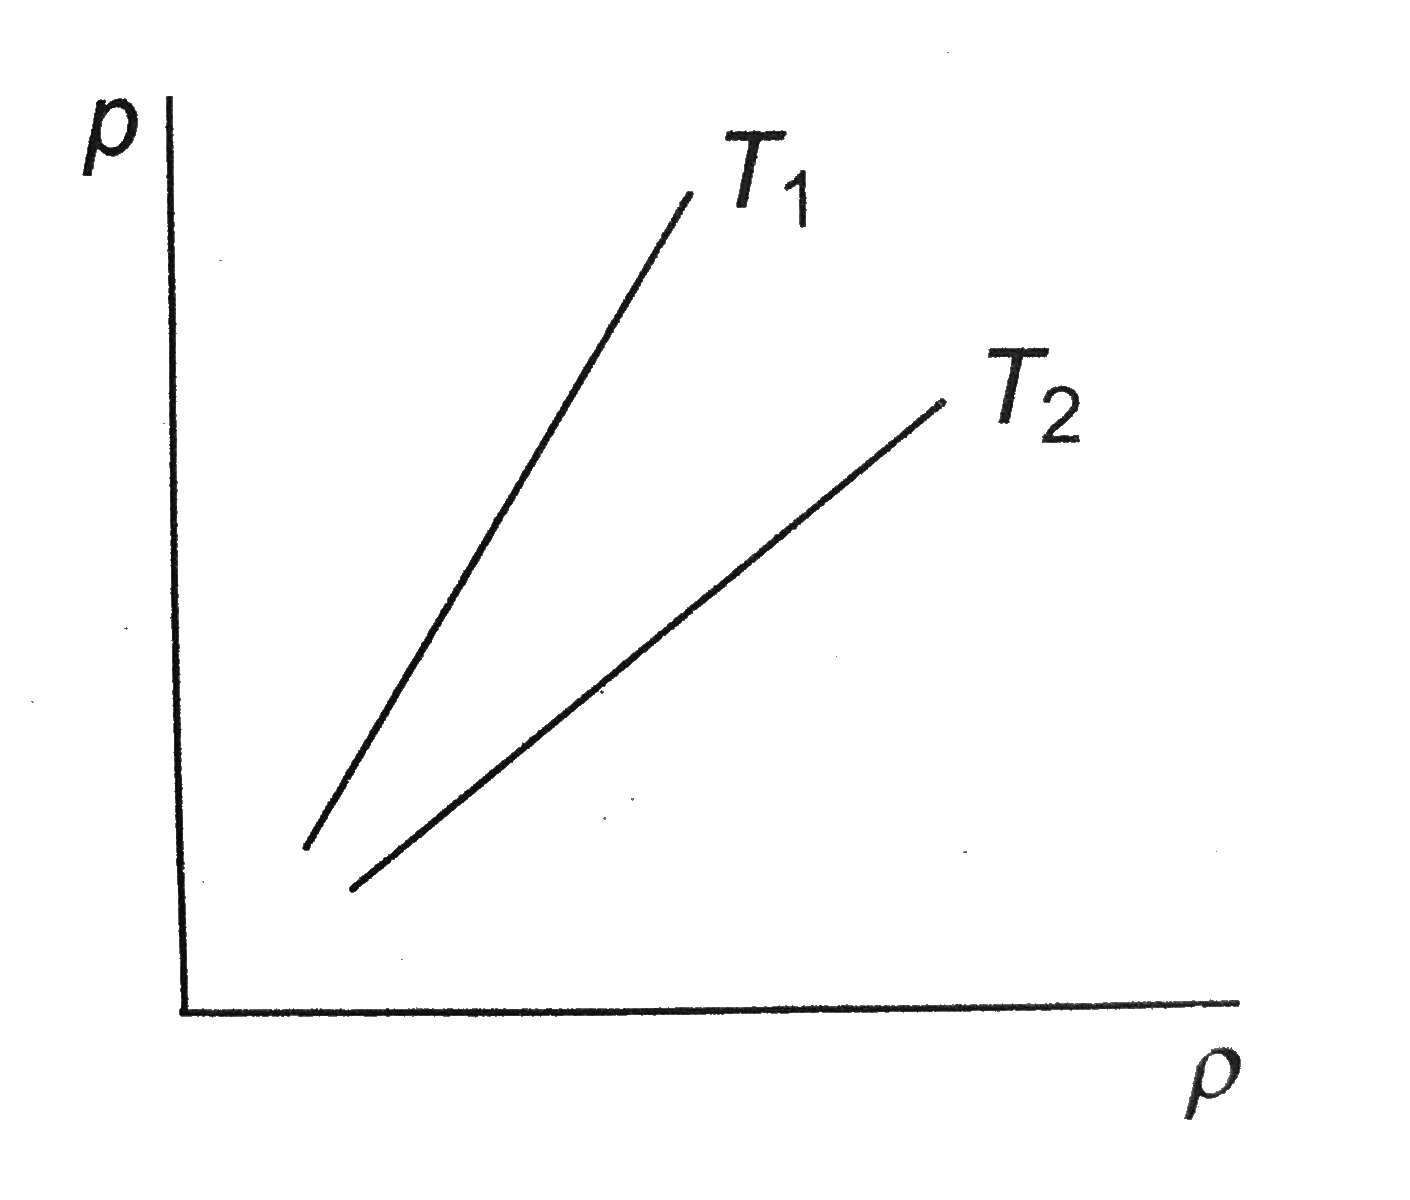
View SolutionFigure shows graphs of pressure versus density for an ideal gas at two temperatures T_(1) and T_(2) Which is correct ? .
View Solutionनिम्न चित्र में एक आदर्श गैस के लिए दाब तथा घनत्व के मध्य ग्राफ दो तापमानों T1 तथा T2 पर खींचे गए हैं। कौन-सा सम्बन्ध सही है?

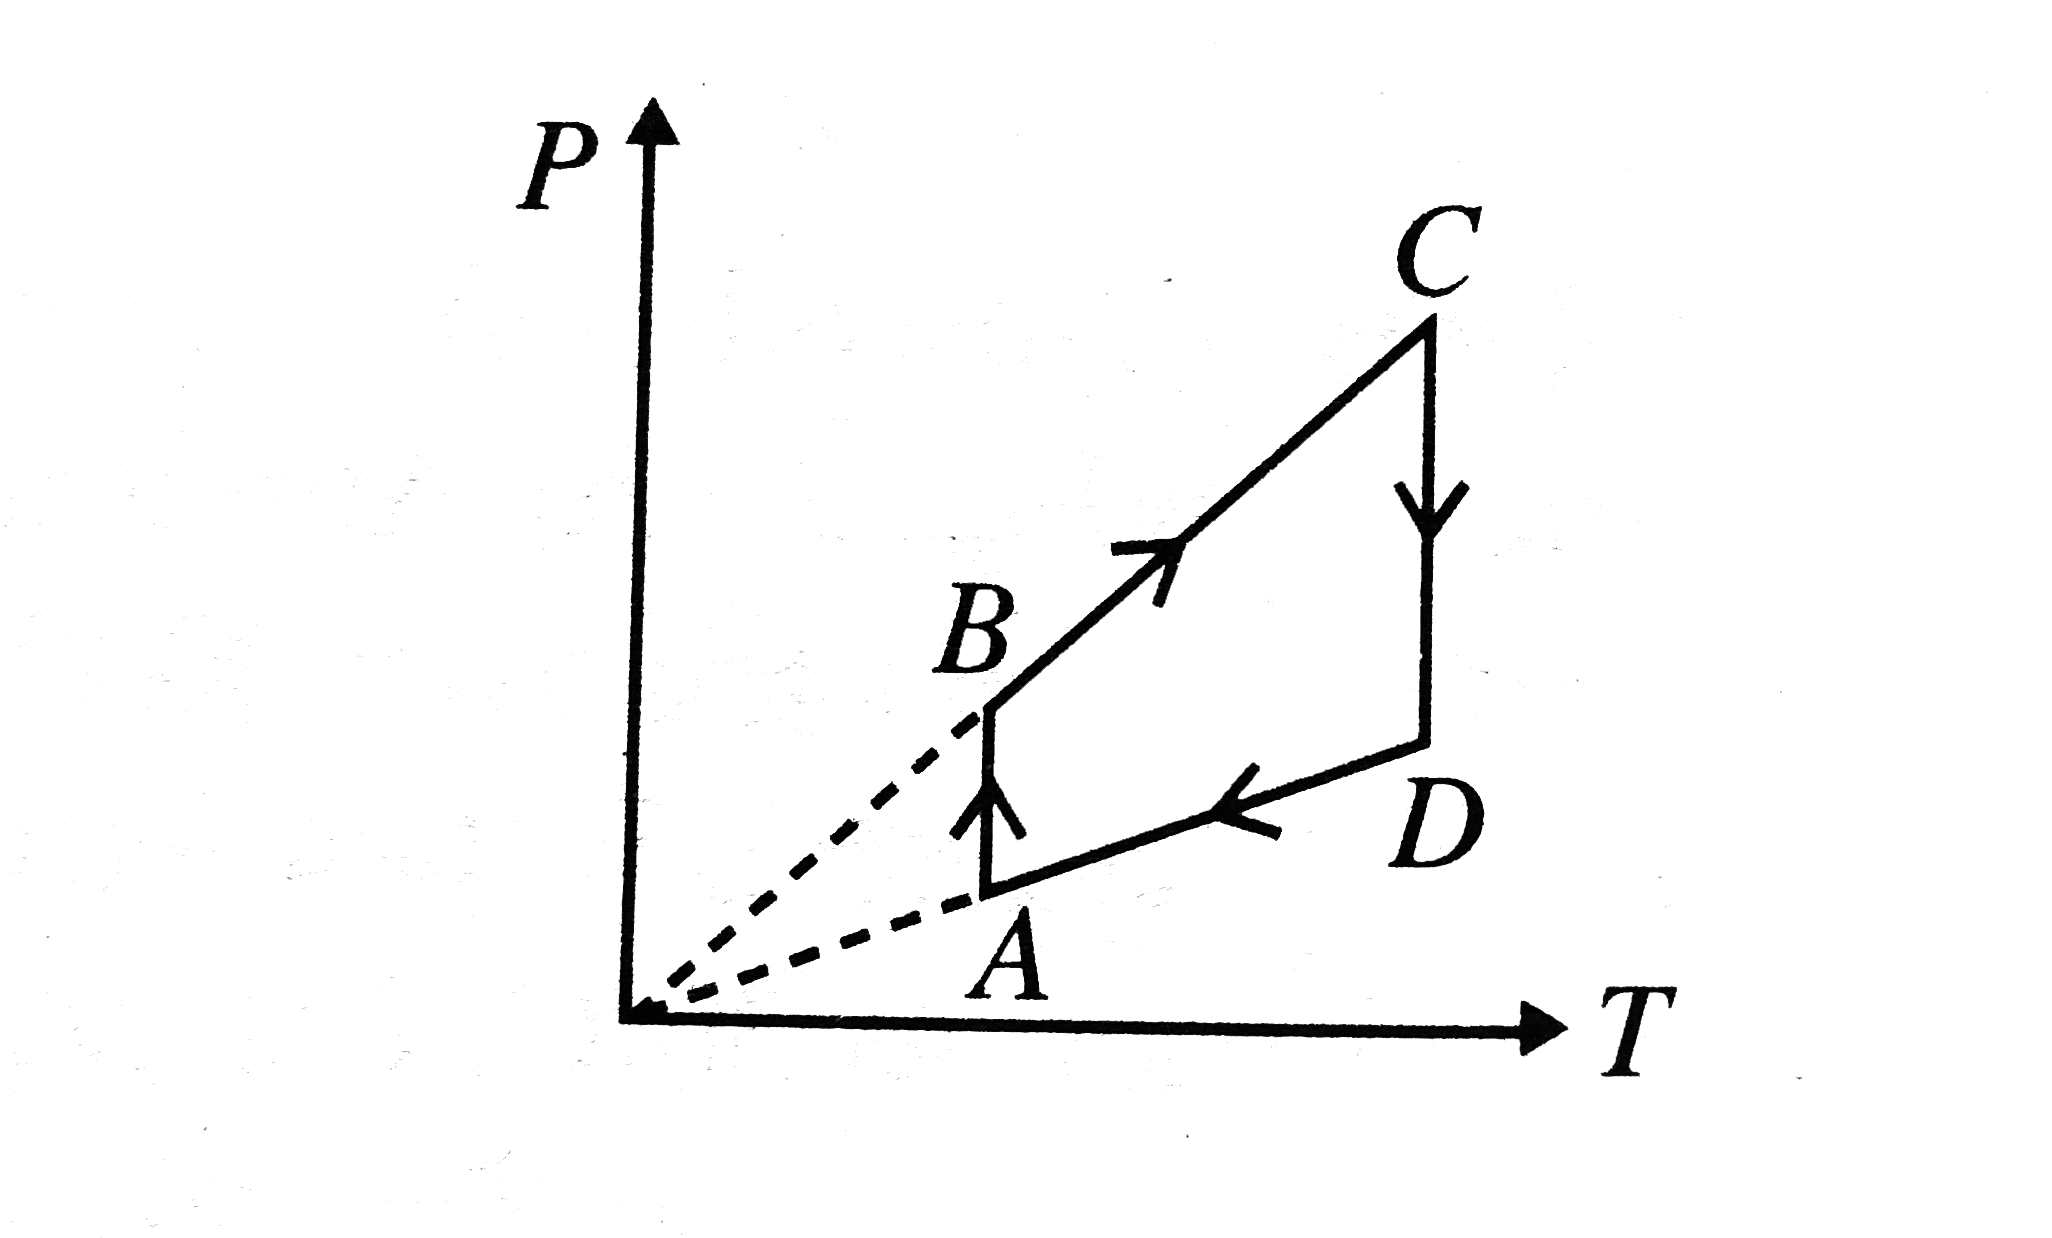
View SolutionPressure versus temperature graph of an ideal gas as shown in Fig.
Corresponding density (ρ) versus volume (V) graph will be

View SolutionThe density (rho) versus pressure (P) graphs of a given mass of an ideal gas is shown at two temperatures T_(1) and T_(2) . Then relation between T_(1) and T_2 may be
View SolutionFigure shows graphs of pressure vs density for an ideal gas at two temperature T1andT2. Which of the following is correct?

View Solution
