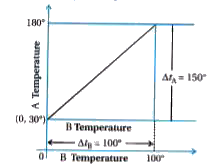
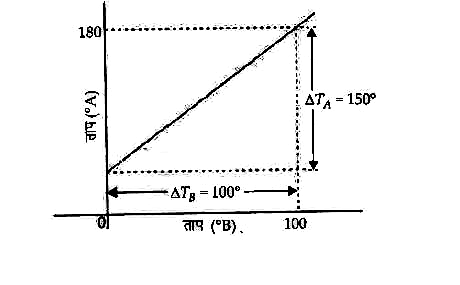
The graph between two temperature scales A and B is shown in Fig. Between upper fixed point and lower fixed point there are 150 equal divisions on scales A and 100 on scale B. The relation between the temperature in two scales is given by_
_S01_001_Q01.png)
tA−180100=tB150
tA−30150=tB100
tB−180150=tA100
tB−40100=tA180
The correct Answer is:B
It is clear from the graph that lowest point for scale A is 30∘ and lowest point for scale B is 0∘. Highest point for the scale A is 100∘. Hence, correct relation is
tA−(LEP)A(UFP)A−(LEP)A=tB−(LEP)B(UFP)B−(LEP)B

⇒tA−30180−30=tB−0100−0
⇒tA−30150=tB100
where, LEP→ Lower fixed point
UFP→ Upper fixed point
Topper's Solved these Questions
- THERMAL PROPERTIES OF MATTERBOOK - NCERT EXEMPLAR ENGLISHCHAPTER - THERMAL PROPERTIES OF MATTEREXERCISE - Very short Answer type Questions
15 Videos
- SYSTEM OF PARTICLES AND ROTATIONAL MOTION BOOK - NCERT EXEMPLAR ENGLISHCHAPTER - SYSTEM OF PARTICLES AND ROTATIONAL MOTION EXERCISE - Long answer type questions
12 Videos
- THERMODYNAMICS BOOK - NCERT EXEMPLAR ENGLISHCHAPTER - THERMODYNAMICS EXERCISE - LONG ANSWER TYPE QUESTIONS
5 Videos
Similar Questions
Is the bulb of a thermoeter made of diathermic or adiabatic wall ?
View SolutionFind the centre of mass of a unifrom (a) half-disc,(b) quarter-disc.
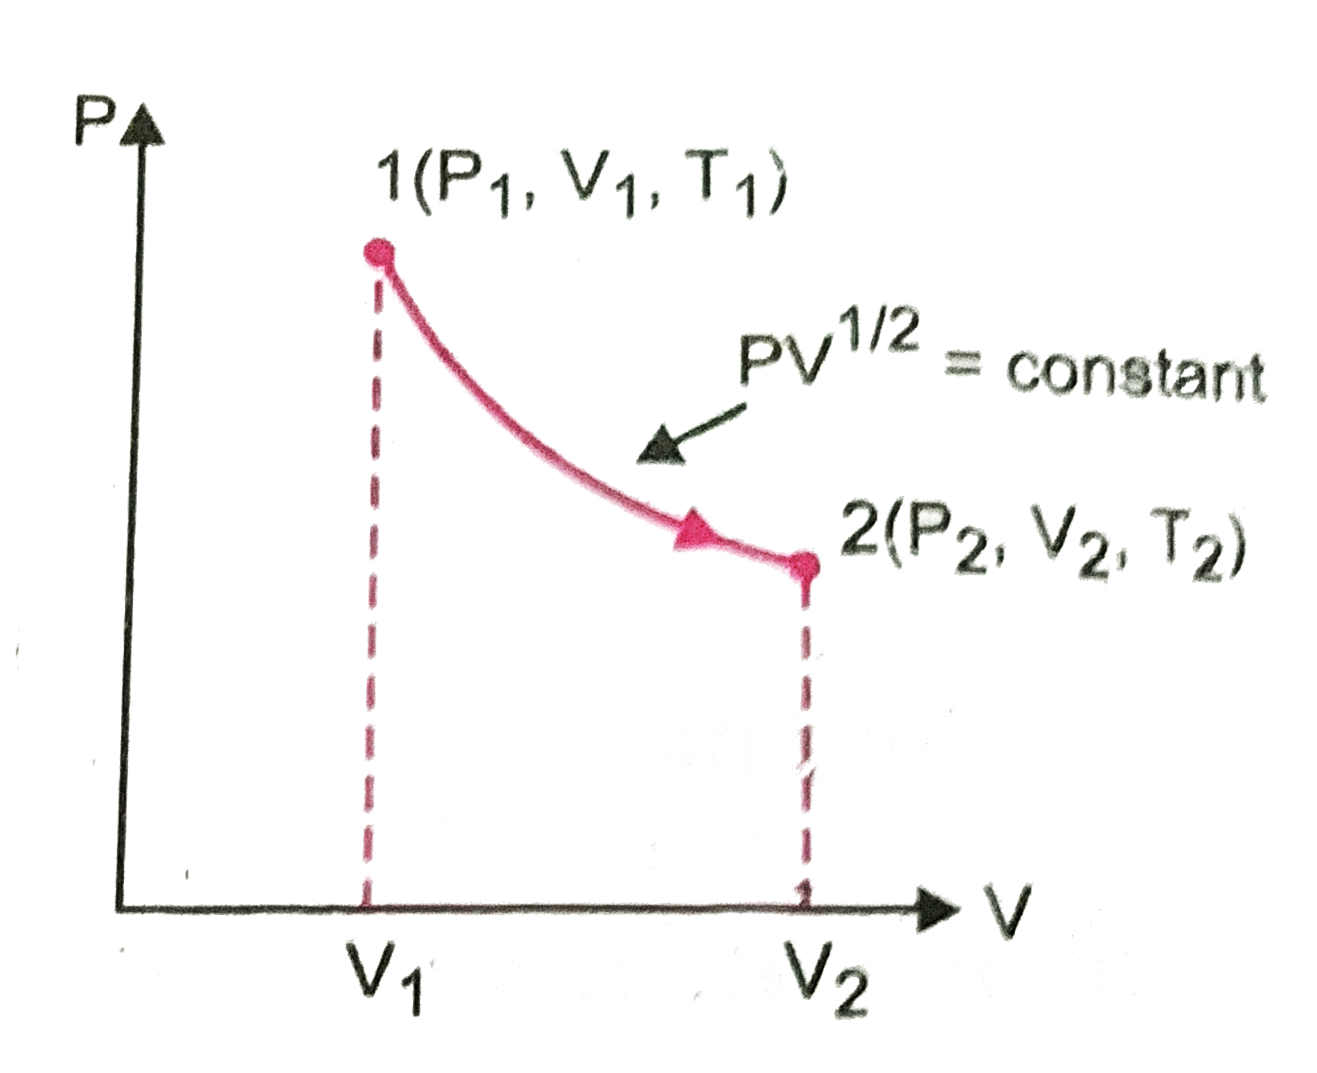
View SolutionConsider a P−V diagram in which the path followed by one mole of perfect gas in a cyclinderical container is shown in (figure)
(a) Find the work done when the gas is taken from state 1 to state 2.
(b) What is the ratio of temperatures T1/T2,ifV2=2V1?
(c ) Given the internal energy for one mole of gas at temperature Tis(3/2)RT, find the heat supplied to the gas when it is taken from state 1 to 2, with V2=2V1.
View SolutionThe graph between two temperature scales A and B is shown in Fig. Between upper fixed point and lower fixed point there are 150 equal divisions on scales A and 100 on scale B. The relation between the temperature in two scales is given by_
_S01_001_Q01.png)
View SolutionA faulty thermometer has its lower fixed point marked as 110^(@) and upper fixed point marked as 110^(@) and upper fixed point marked as 110^(@) . If the temperature of the body shown in this scale is 62^(@) , the temperature shown on the Celsius scale is
View SolutionThe fundamental interval, that is the number of divisions between LFP and UFP on the two scales X and Y are 50 and 150 respectively. The ice point on both the scales is at 0^(@) . If the temperature on the X scaleis 15^(@) , then what is the temperature on the Y-scale?
View Solutionफॉरेनहाइट स्केल का निम्न नियत बिन्दु तथा ऊपरी नियत बिन्दु होता है
View SolutionThe graph between two temperature scales A and B is shown in figure. Between upper fixed point and lower fixed point there are 150 equal division on A and 100 on scale B. The relationship for conversion between the two scales is given by
View SolutionWhat are two fixed points on a temperature scale?
View SolutionThe graph between two temperature scales A and B is shown in Fig. Between upper fixed point and lower fixed point there are 150 equal divisions on scales A and 100 on scale B. The relation between the temperature in two scales is given by_
_S01_001_Q01.png)
View SolutionPassage - I: The graph between two temperature scales A and B is as shown in fig. Between upper fixed and lower fixed points there are 150 equal divisions on scale A and 100 on scale B. Lower fixed point on scale B and scale A.
View SolutionPassage - I: The graph between two temperature scales A and B is as shown in fig. Between upper fixed and lower fixed points there are 150 equal divisions on scale A and 100 on scale B. The relation between two scales A and B is given by
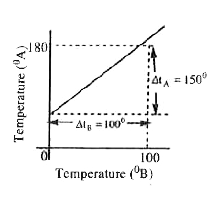
View SolutionThe graph between two temperature scales A and B is shown in Fig. 11.1 Between upper fixed point and lower fixed point there
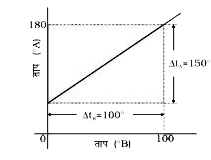
View Solutionचित्र 11.1 में दो तापक्रमों A तथा B के बीच ग्राफ दर्शाया गया है। स्केल A तथा B पर निम्न नियत तापांक तथा उच्च नियत तापांक के बीच क्रमशः 150 तथा 100 समान भाग है|
दोनों स्केलों के बीच रूपांतरण के लिए दिया गया संबंध है -
View SolutionMention different scales of temperature, mentioning their lower and upper fixed points, Establish a relation between them.
View Solutionदो ताप पैमाने A एवं B के मध्य ग्राफ को चित्र में दिखाया गया है। ऊपरी स्थिर बिन्दु एवं निचले स्थिर बिन्दु के मध्य पैमाने A पर 150 समान भाग तथा पैमाने B पर 100 भाग हैं। दोनों पैमानों के मध्य परिवर्तन के लिए सम्बन्ध हैं -
View Solution

