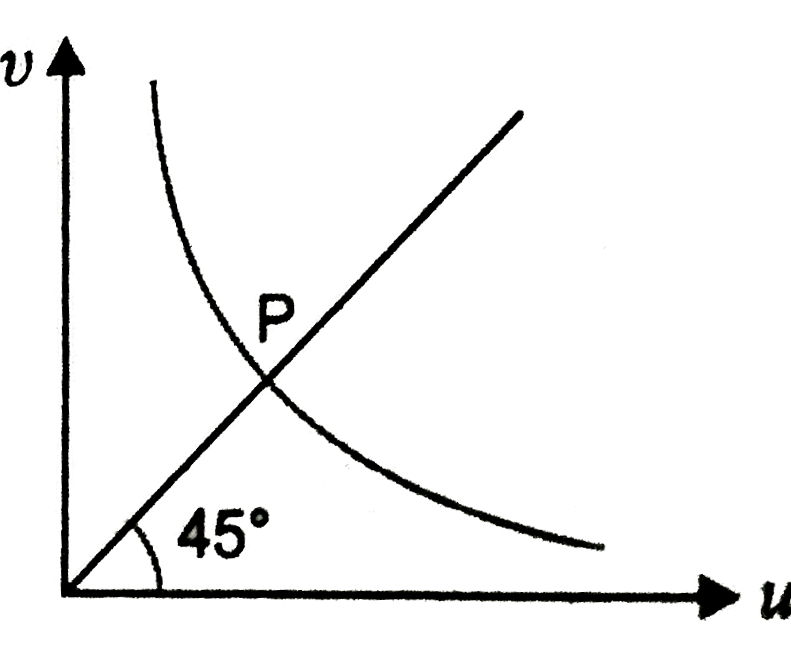
The graph in Fig. shows plot of variation of v with change in u for a concave mirror. Points plotted above the point P on the curve are for values of v :
 .
.
Smaller then f
Smaller then 2 f
Larger then 2 f
Larger than f
The correct Answer is:c
Step by step video, text & image solution for The graph in Fig. shows plot of variation of v with change in u for a concave mirror. Points plotted above the point P on the curve are for values of v : . by Physics experts to help you in doubts & scoring excellent marks in Class 12 exams.
Updated on:21/07/2023Topper's Solved these Questions
Similar Questions
Knowledge Check
The graph shows variation of v with change in u for a mirrorr. Points plotted above the point P on the curve are for values of v
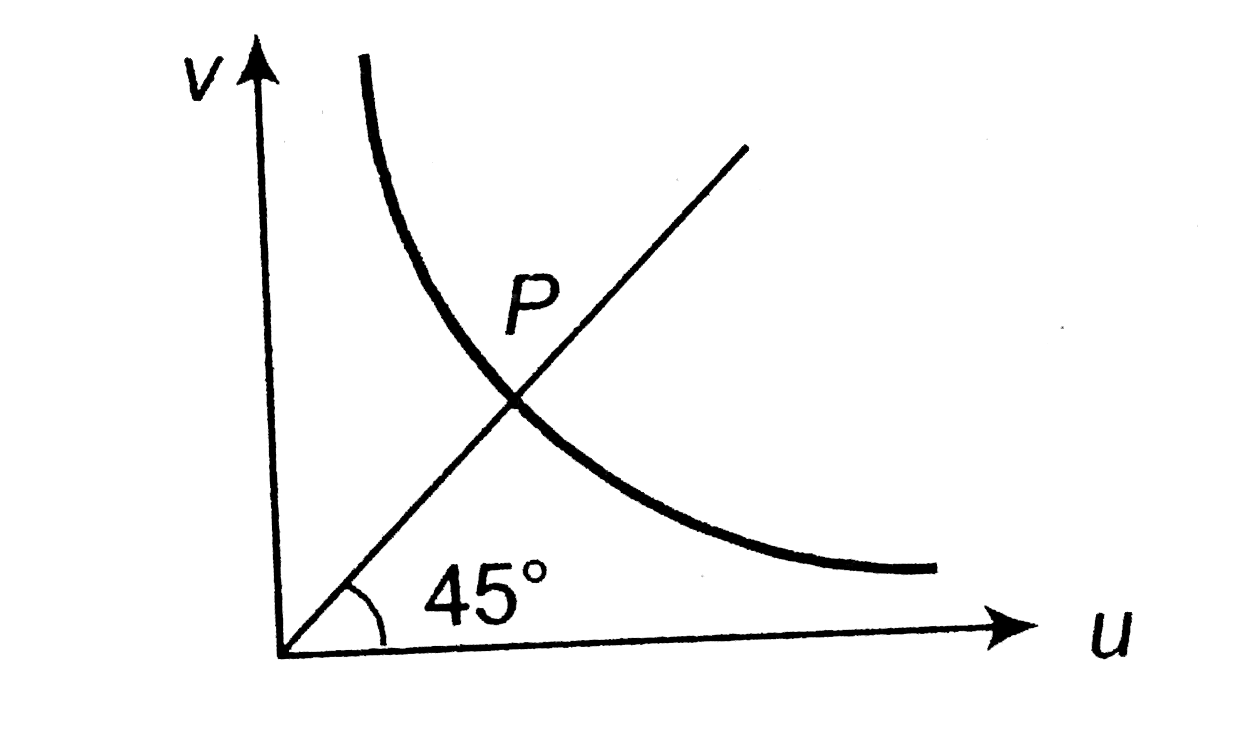 Asmaller than fBsmaller than 2fClarger than 2fDlarger than f
A real inverted image in a concave mirror is represented by (u,v, f are corrdinates)
A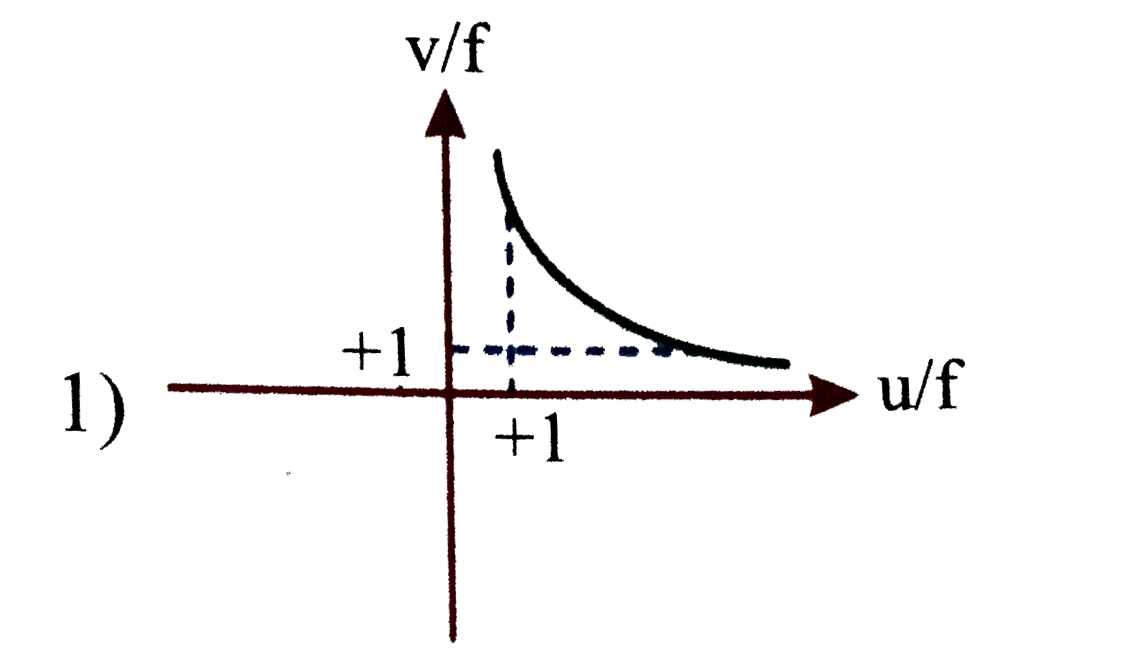 B
B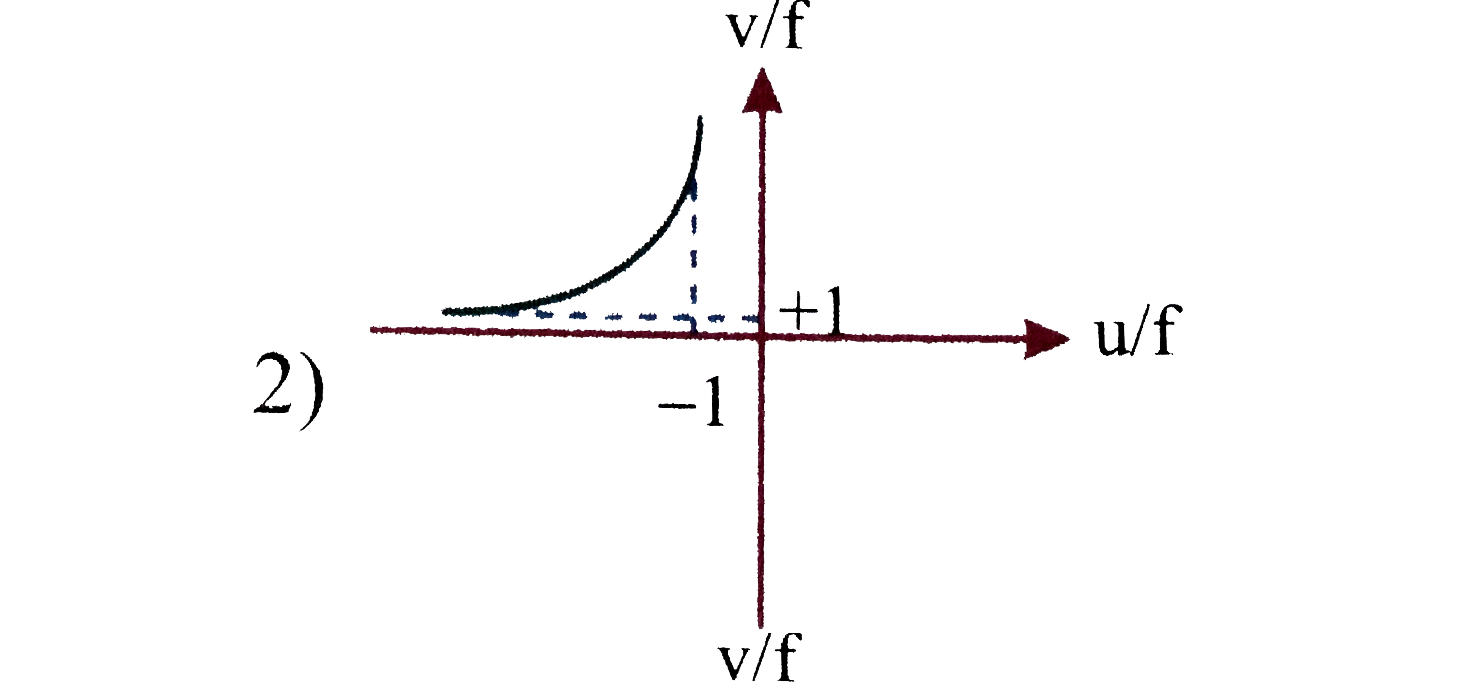 C
C D
D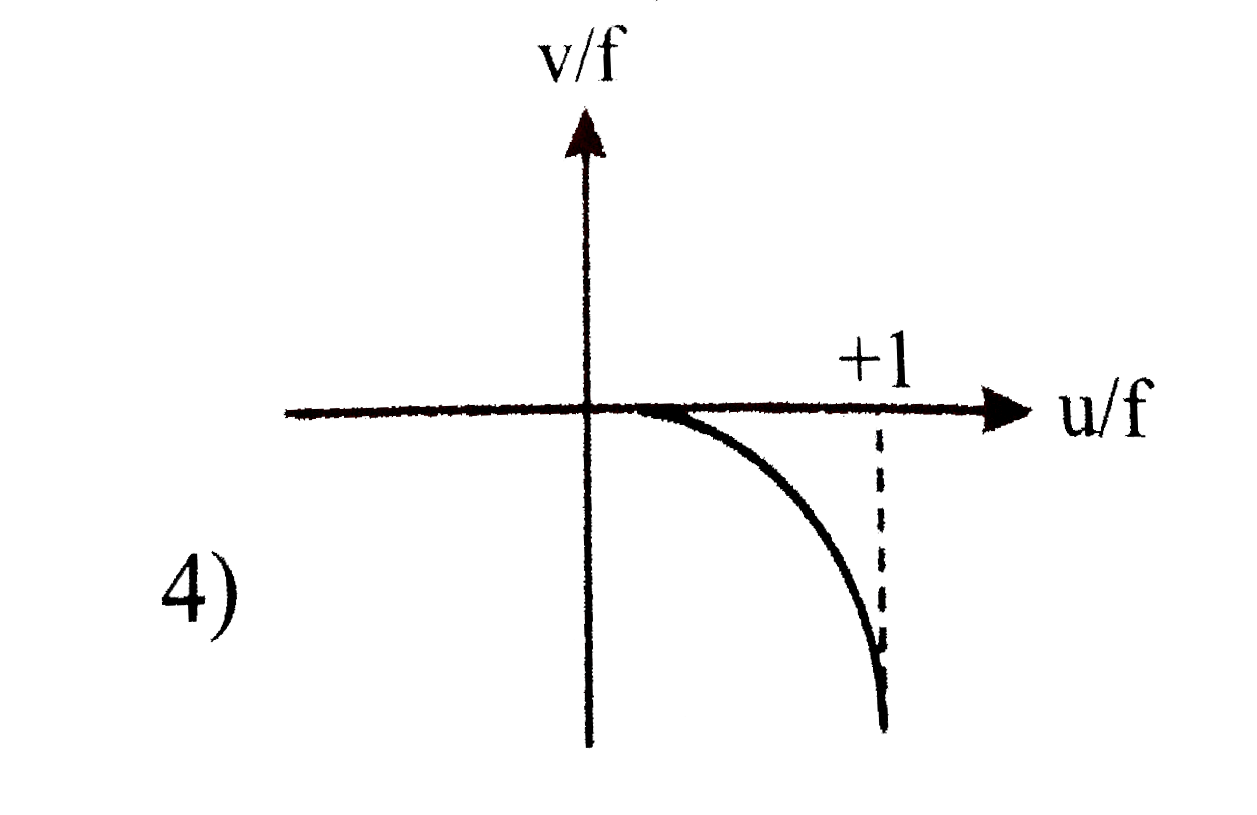
The graph between 1v and 1u for a concave mirror looks like.
A B
B C
C D
D
Plot the point (4, 3) on a graph sheet. Is it the same as the point (3, 4)?
View SolutionA real inverted image in a concave mirror is represented by (u,v, f are corrdinates)
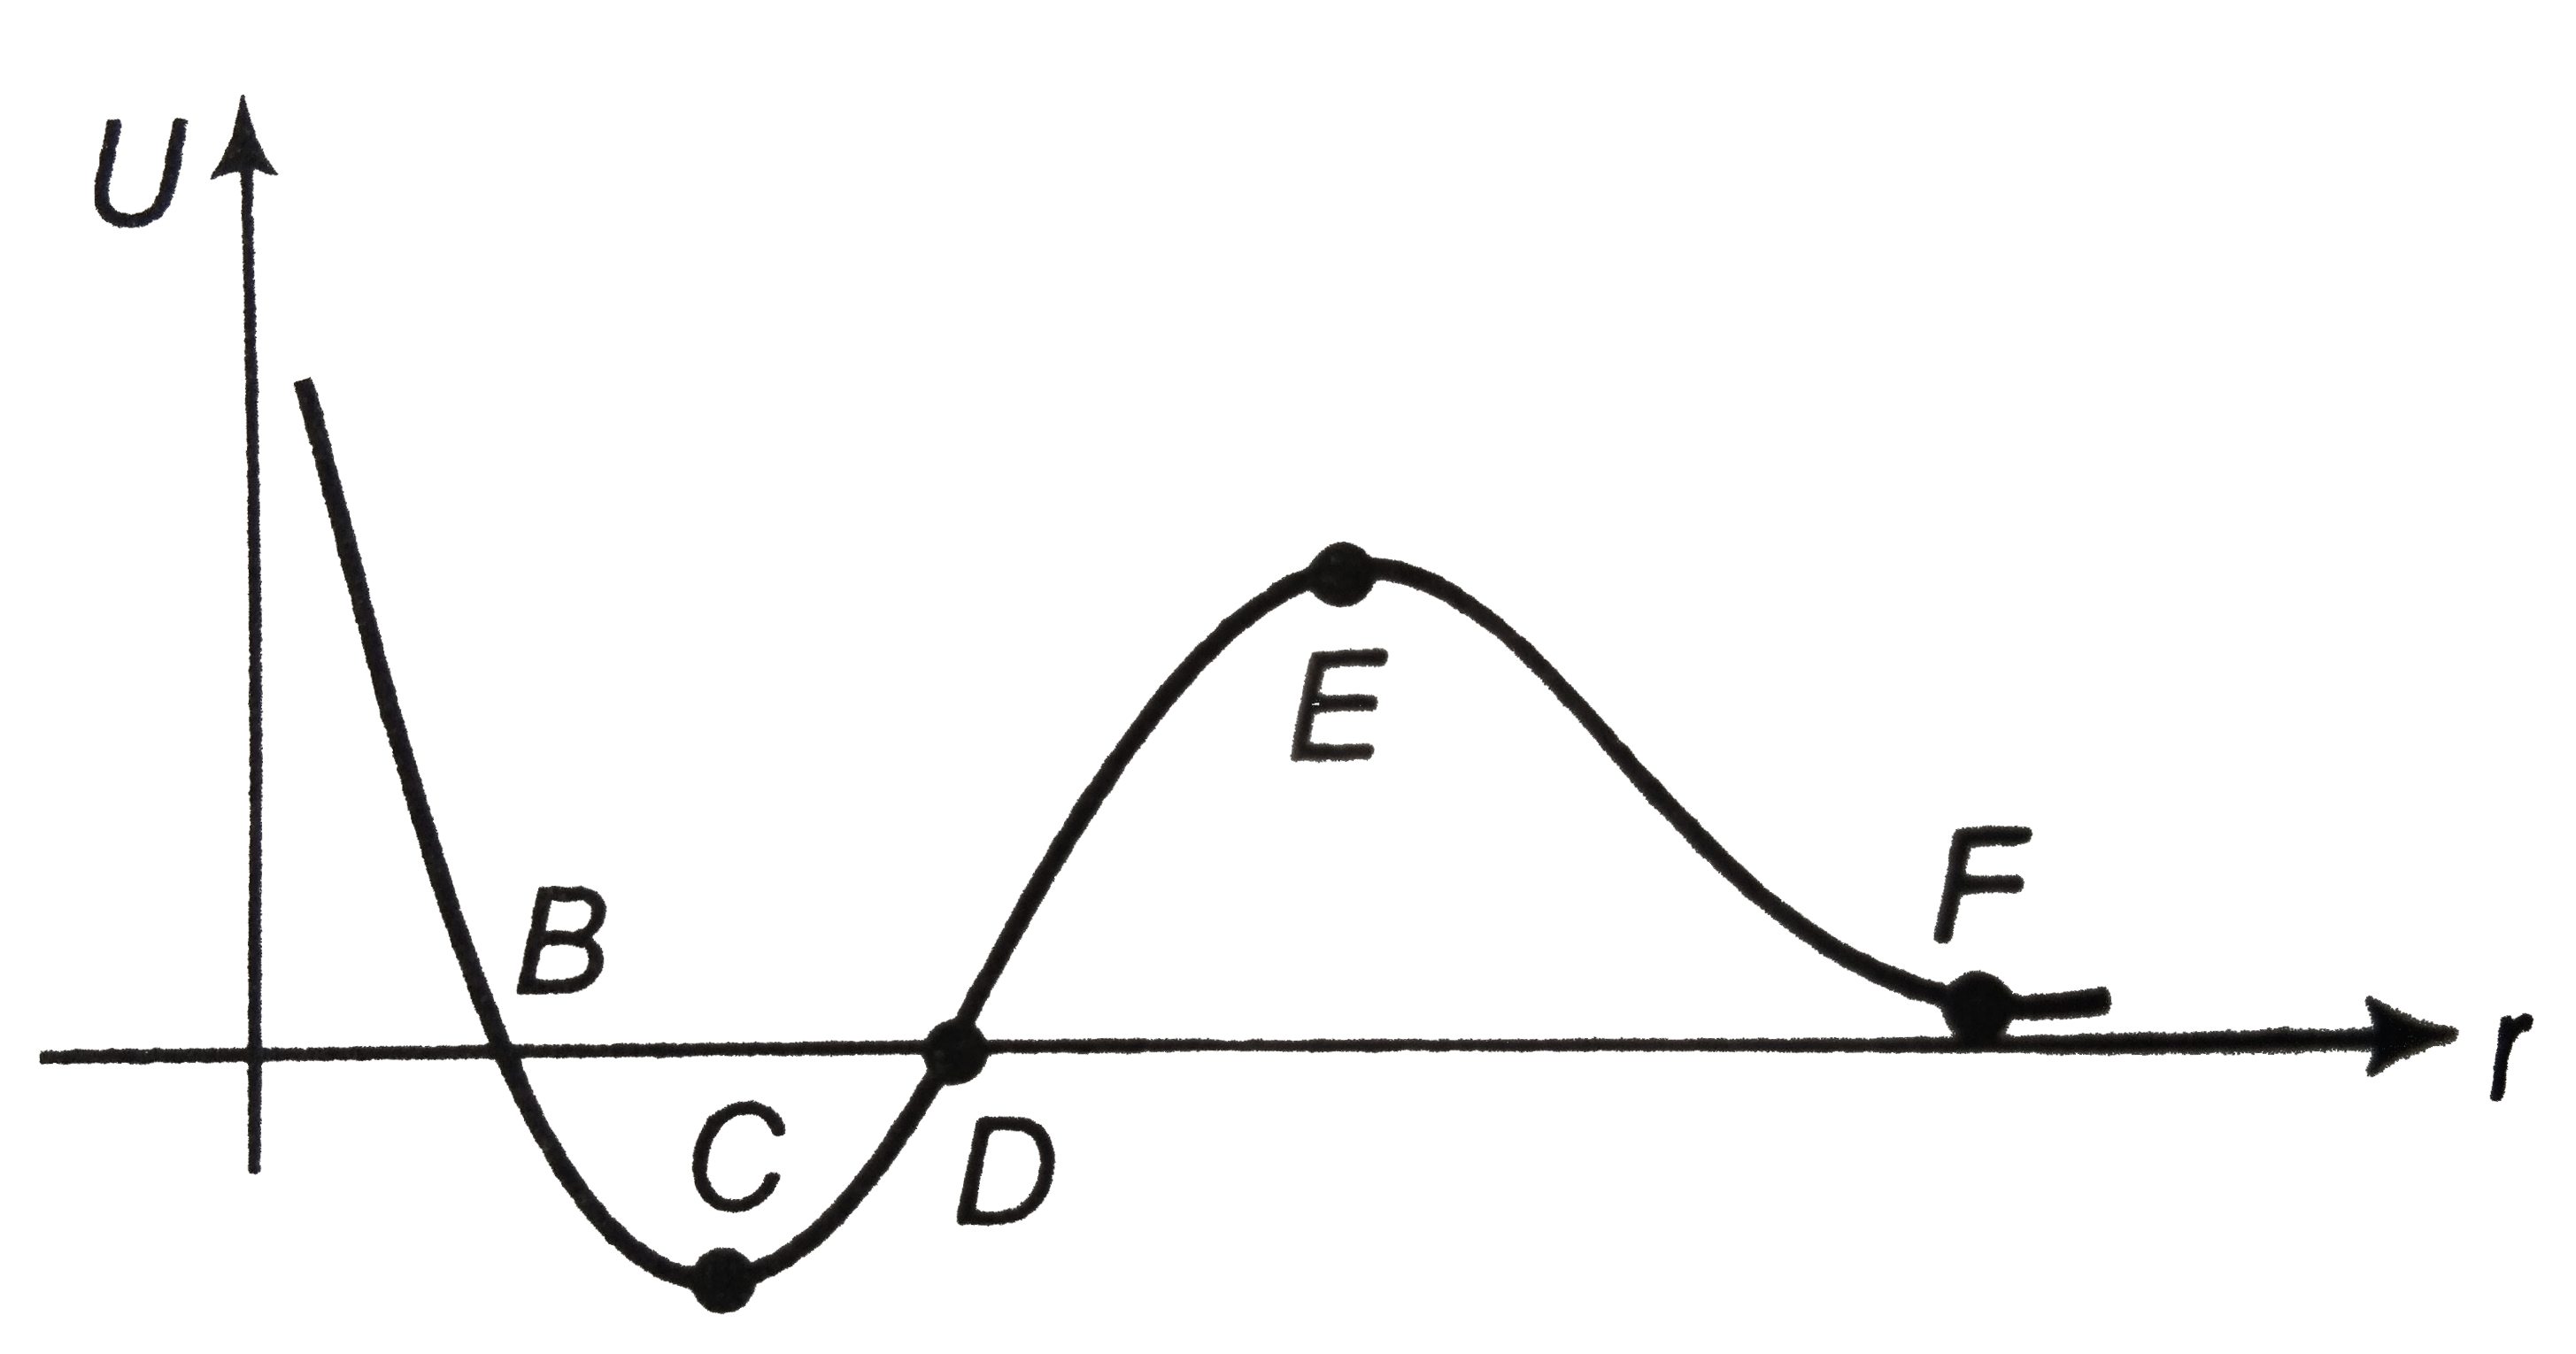
View SolutionThe given plot shows the variation of U, the potential energy of interaction between two particles with the distance separating them r,
View SolutionThe graph showing correctly the variation of image distance (v) as a function of object distance (u) in case of a concave mirror is
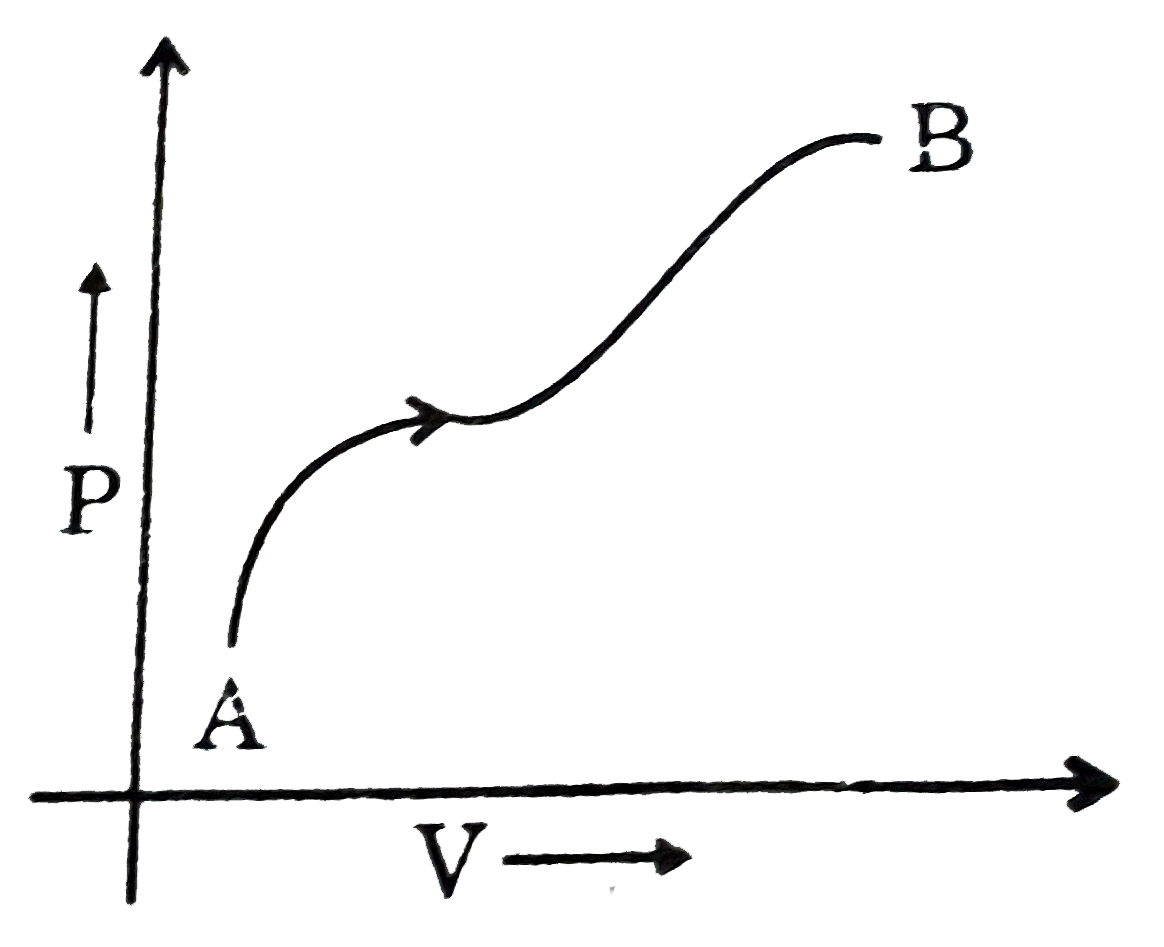
View SolutionThe graph given below shows the P-V plot for a process on an ideal gas. Select the correct statement.
View Solution
