The p-T graph for the given mass of an ideal gas is shown in figure. What inference can be drawn regarding the change in volume (whether it is constant, increasing or decreasing) ?
How to proceed Definitely, it is not constant. Because when volume of the gas is constant p−T graph is a straight line passing through origin. The given line does not pass through origin, hence volume is not constant. 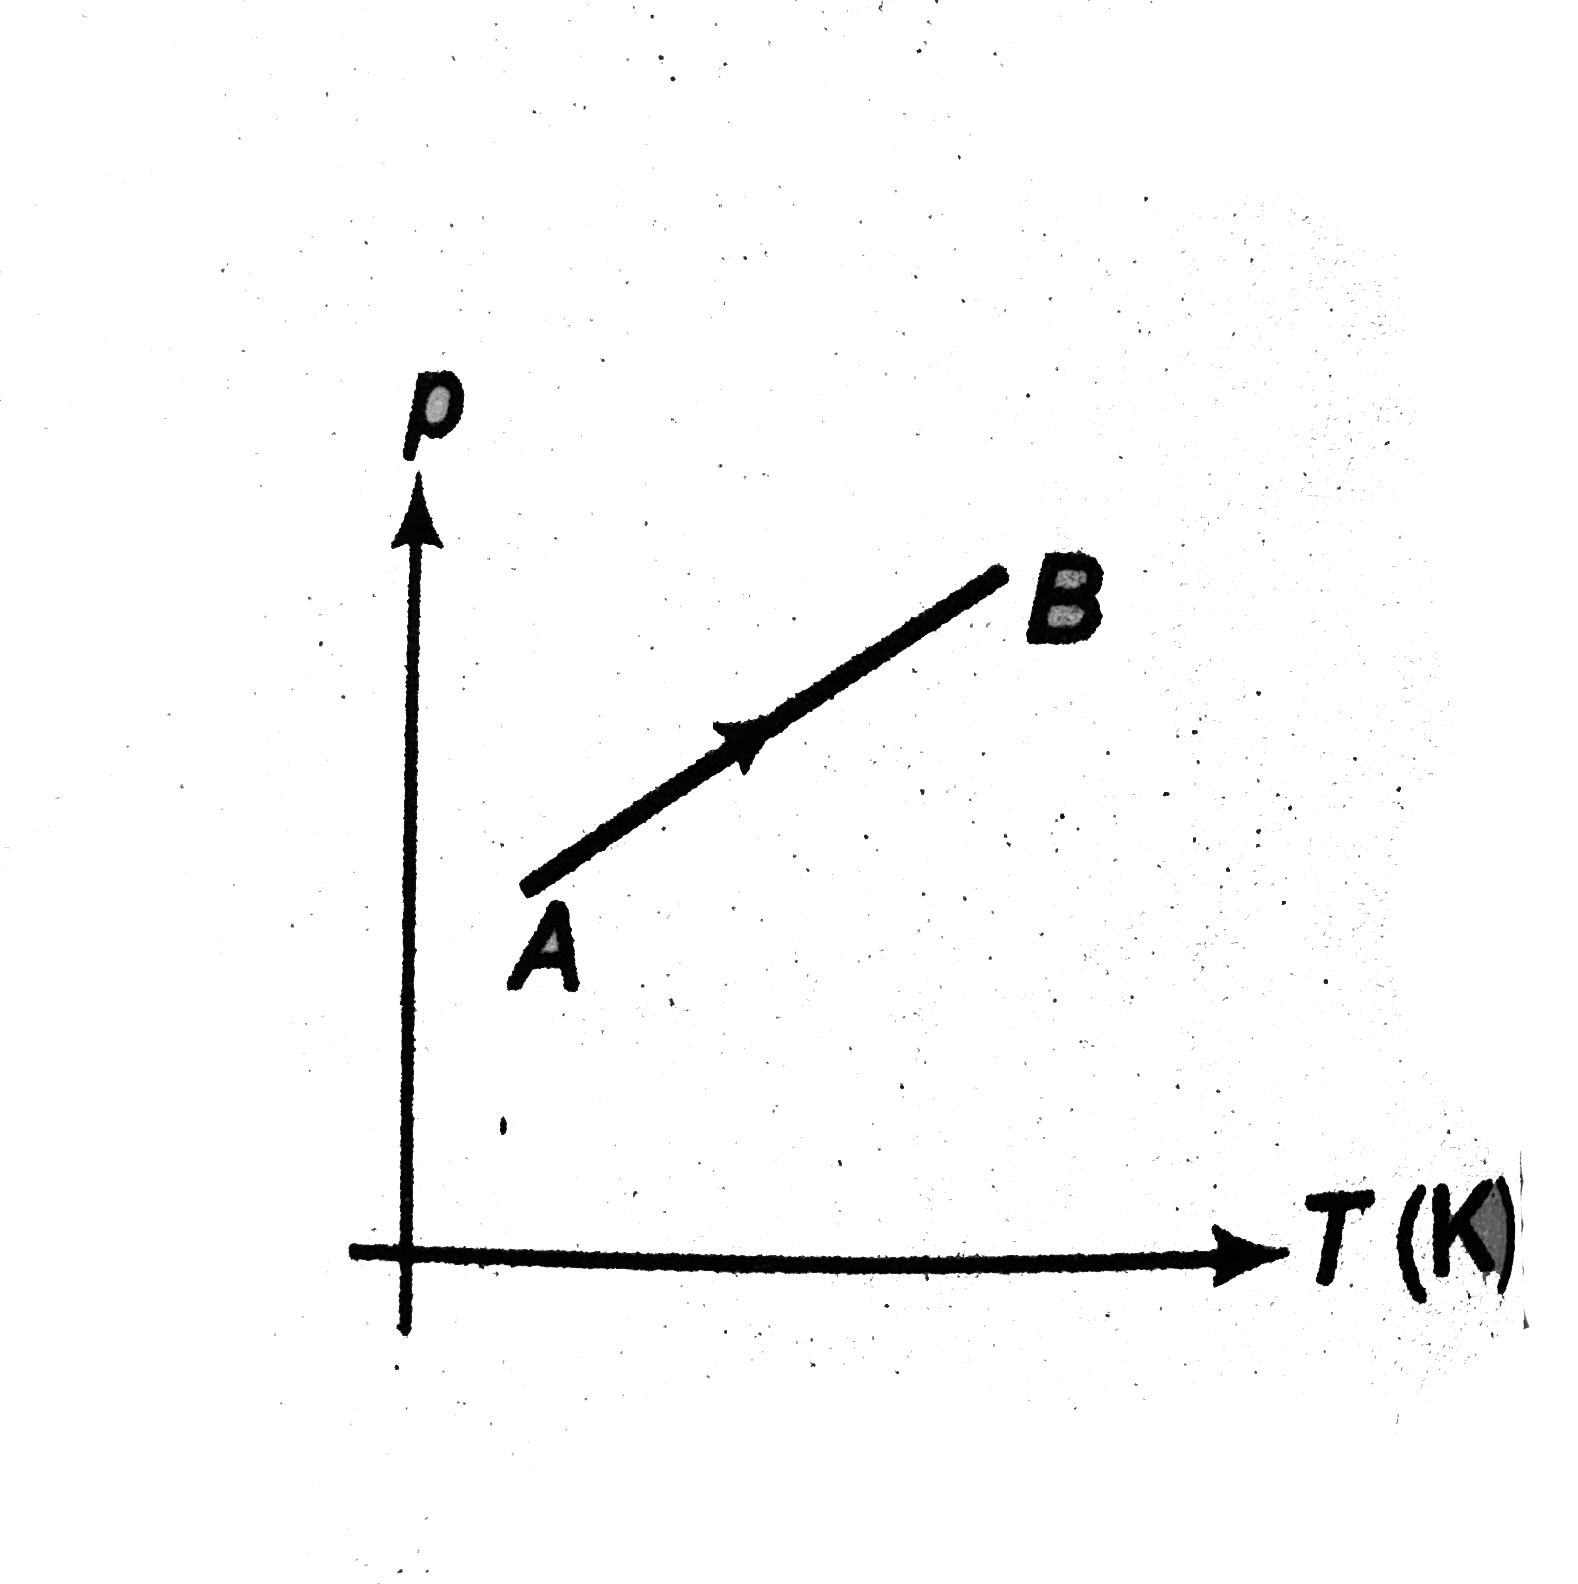 .
.
V=(nR)(TP)
Now, to see volume of the gas we will have to see whether TP is increasing or decreasing.
The correct Answer is:A, B
From the given graph, we can write the p−Tequation as
p=aT+b
Now, TB>TA
:. bTB<bTAor(PT)B<(PT)A
or (TP)B>(PT)A
or VB>VA
Thus, as we move from A to B, volume of the gas is increasimg.
Similar Questions
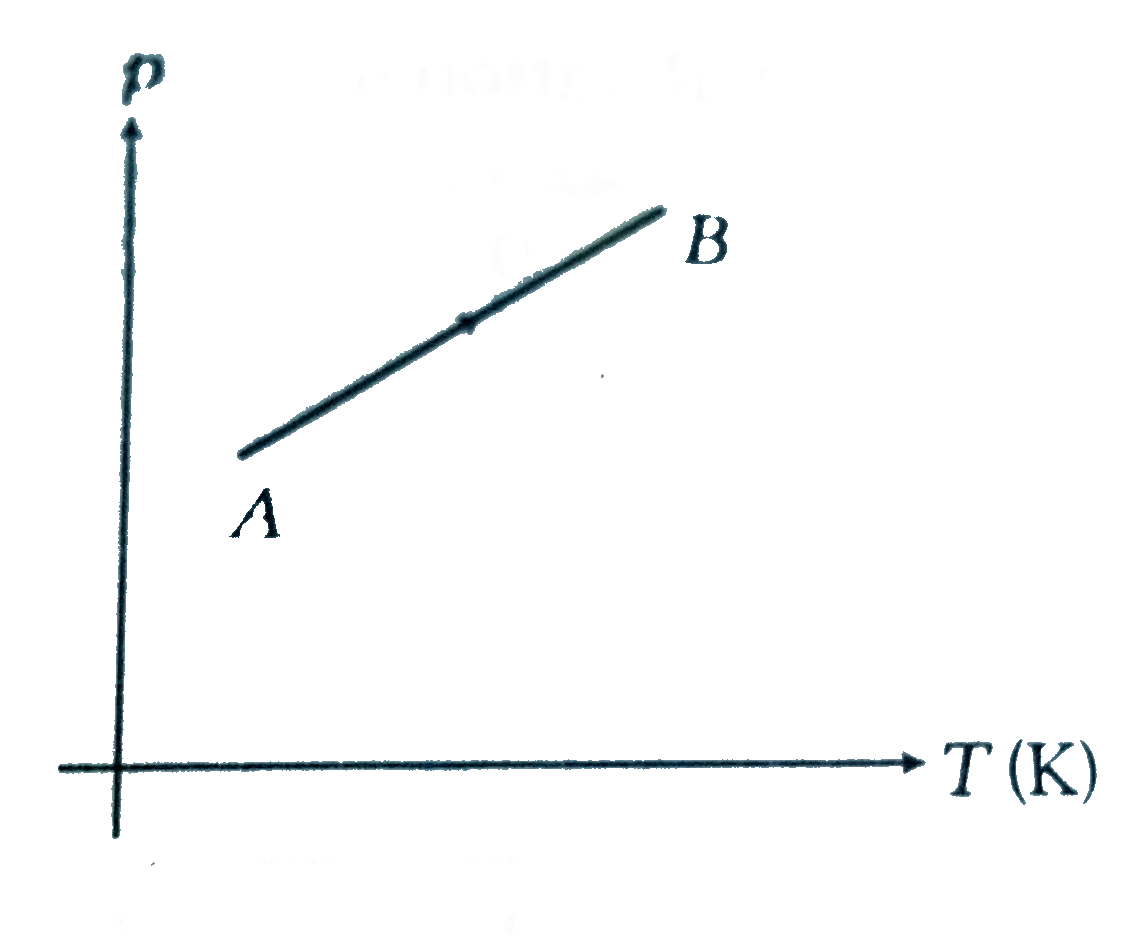
The p−T graph for the given mass of an ideal gas is shown in figure. What inference can be drawn regarding the change in Volume (whtherit is constant, increasing or decreasing) ?
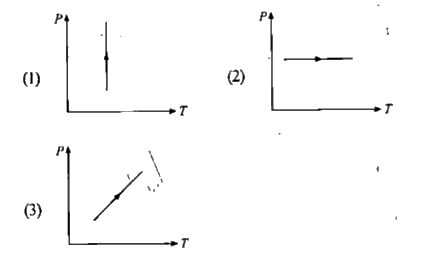
View SolutionP-T graphs of an ideal gas are as shown in figures-2.42 below. Choose the wrong statement from the options given:
View Solution
Knowledge Check
The P−T graph for the given mass of an ideal gas is shown in figure. Then the volume
_E01_022_Q01.png) AincreasesBdecreasesCremains constantDdata insuficient
AincreasesBdecreasesCremains constantDdata insuficientP–V diagram of a monatomic gas is a straight line passing through origin. The molar heat capacity of the gas in the process will be:
A3R2BR2C2RD3RP-V diagram of a diatomic gas is a straight line passing through origin. The molar heat capacity of the gas in the process will be
A4RB2.5RC3RD4R3
P-V diagram of an ideal diatomic gas is a straight line passing through origin. The molar heat capacity of the gas in the process is xR. Find x (Here R - Universal gas constant)
View SolutionThe slope of T−P graph for a given mass of a gas increases, the volumn of the gas
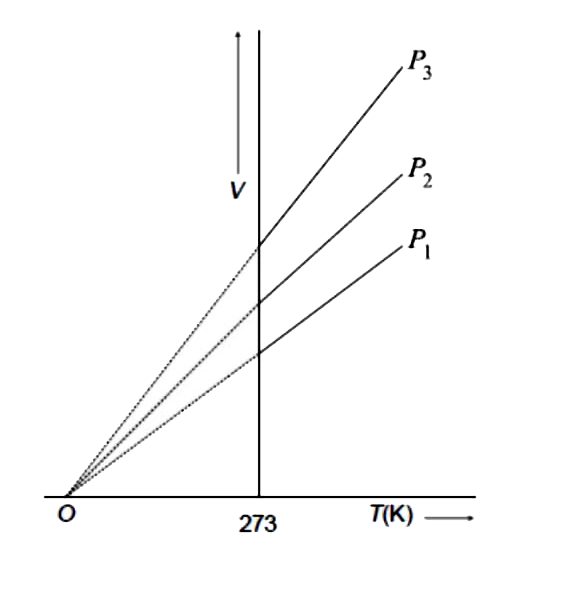
View SolutionThe volume-temperature graphs of a given mass of an ideal gas at constant pressure are shown below. What is the correct order of pressure ?
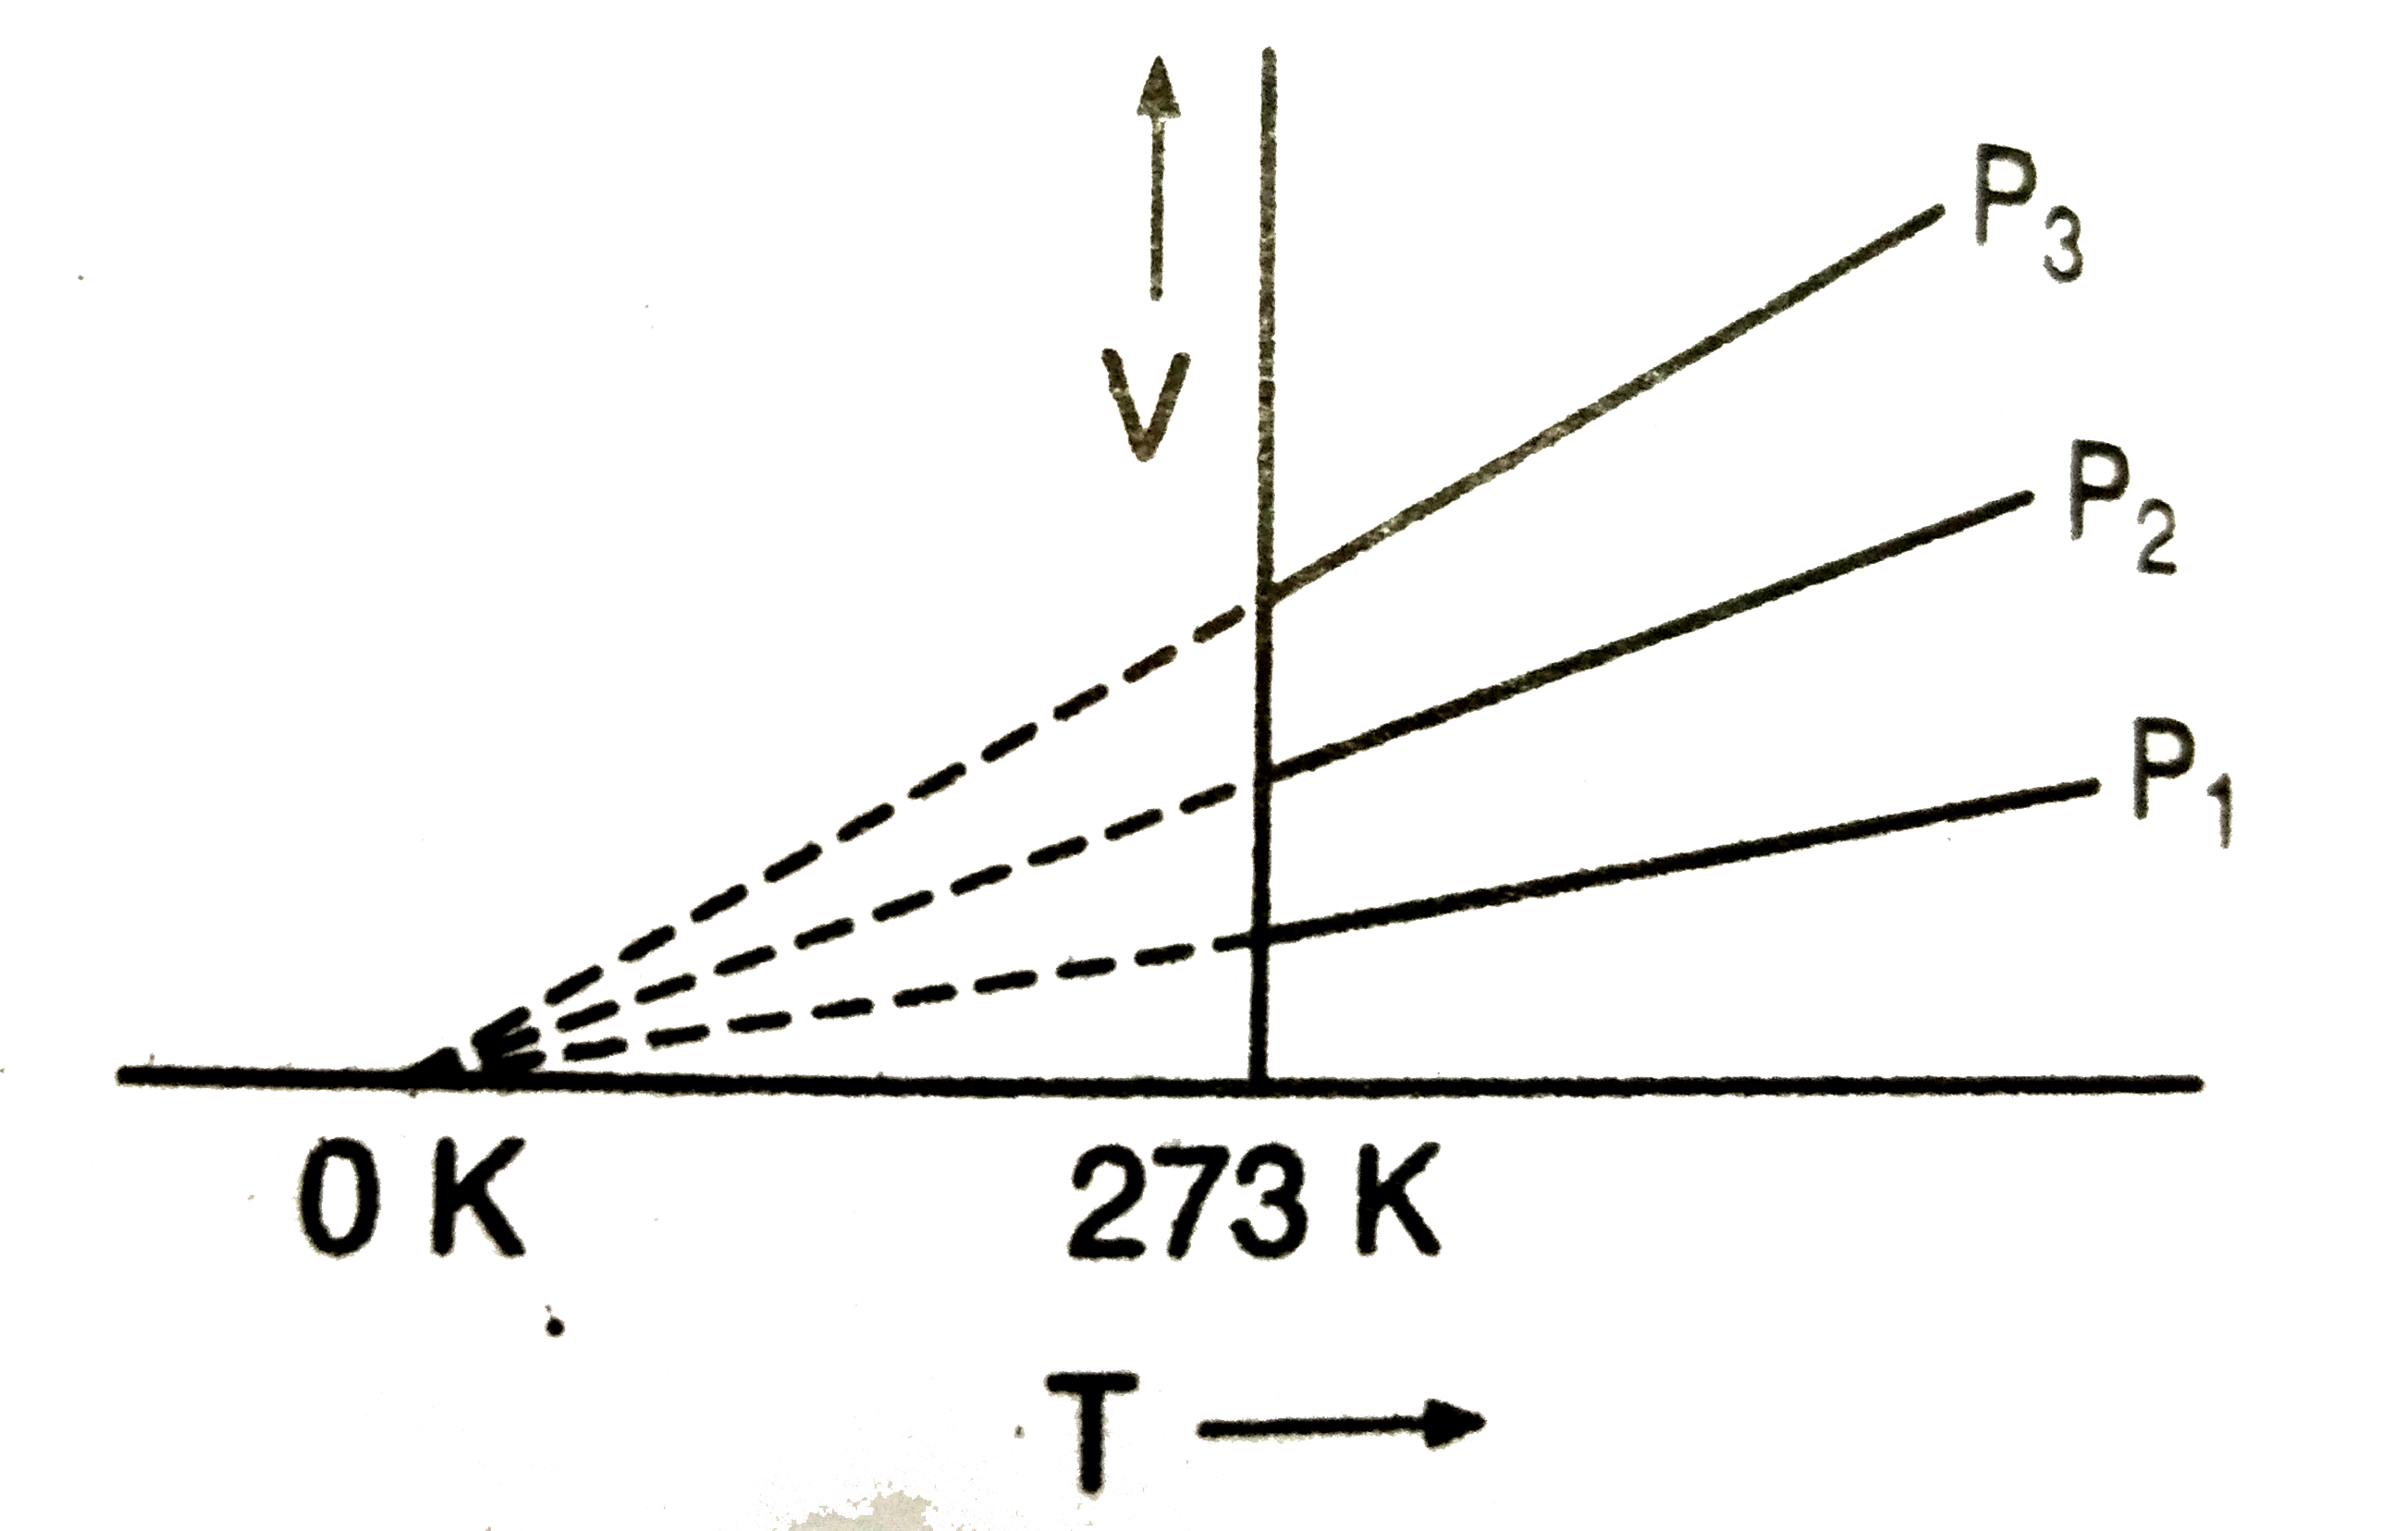
View SolutionThe volume-temperature graphs of a given mass of an ideal gas at constant pressures are shown below. What is the correct order of pressures ?
View SolutionIn isobaric process, (V - T) graph is a straight line passing through origin. Slope of this line is directly proportional to mass of the gas. (V) is taken on (y - axis).
V=(nRp)T
∴ Slope∝n
or slope∝m.
View Solution

