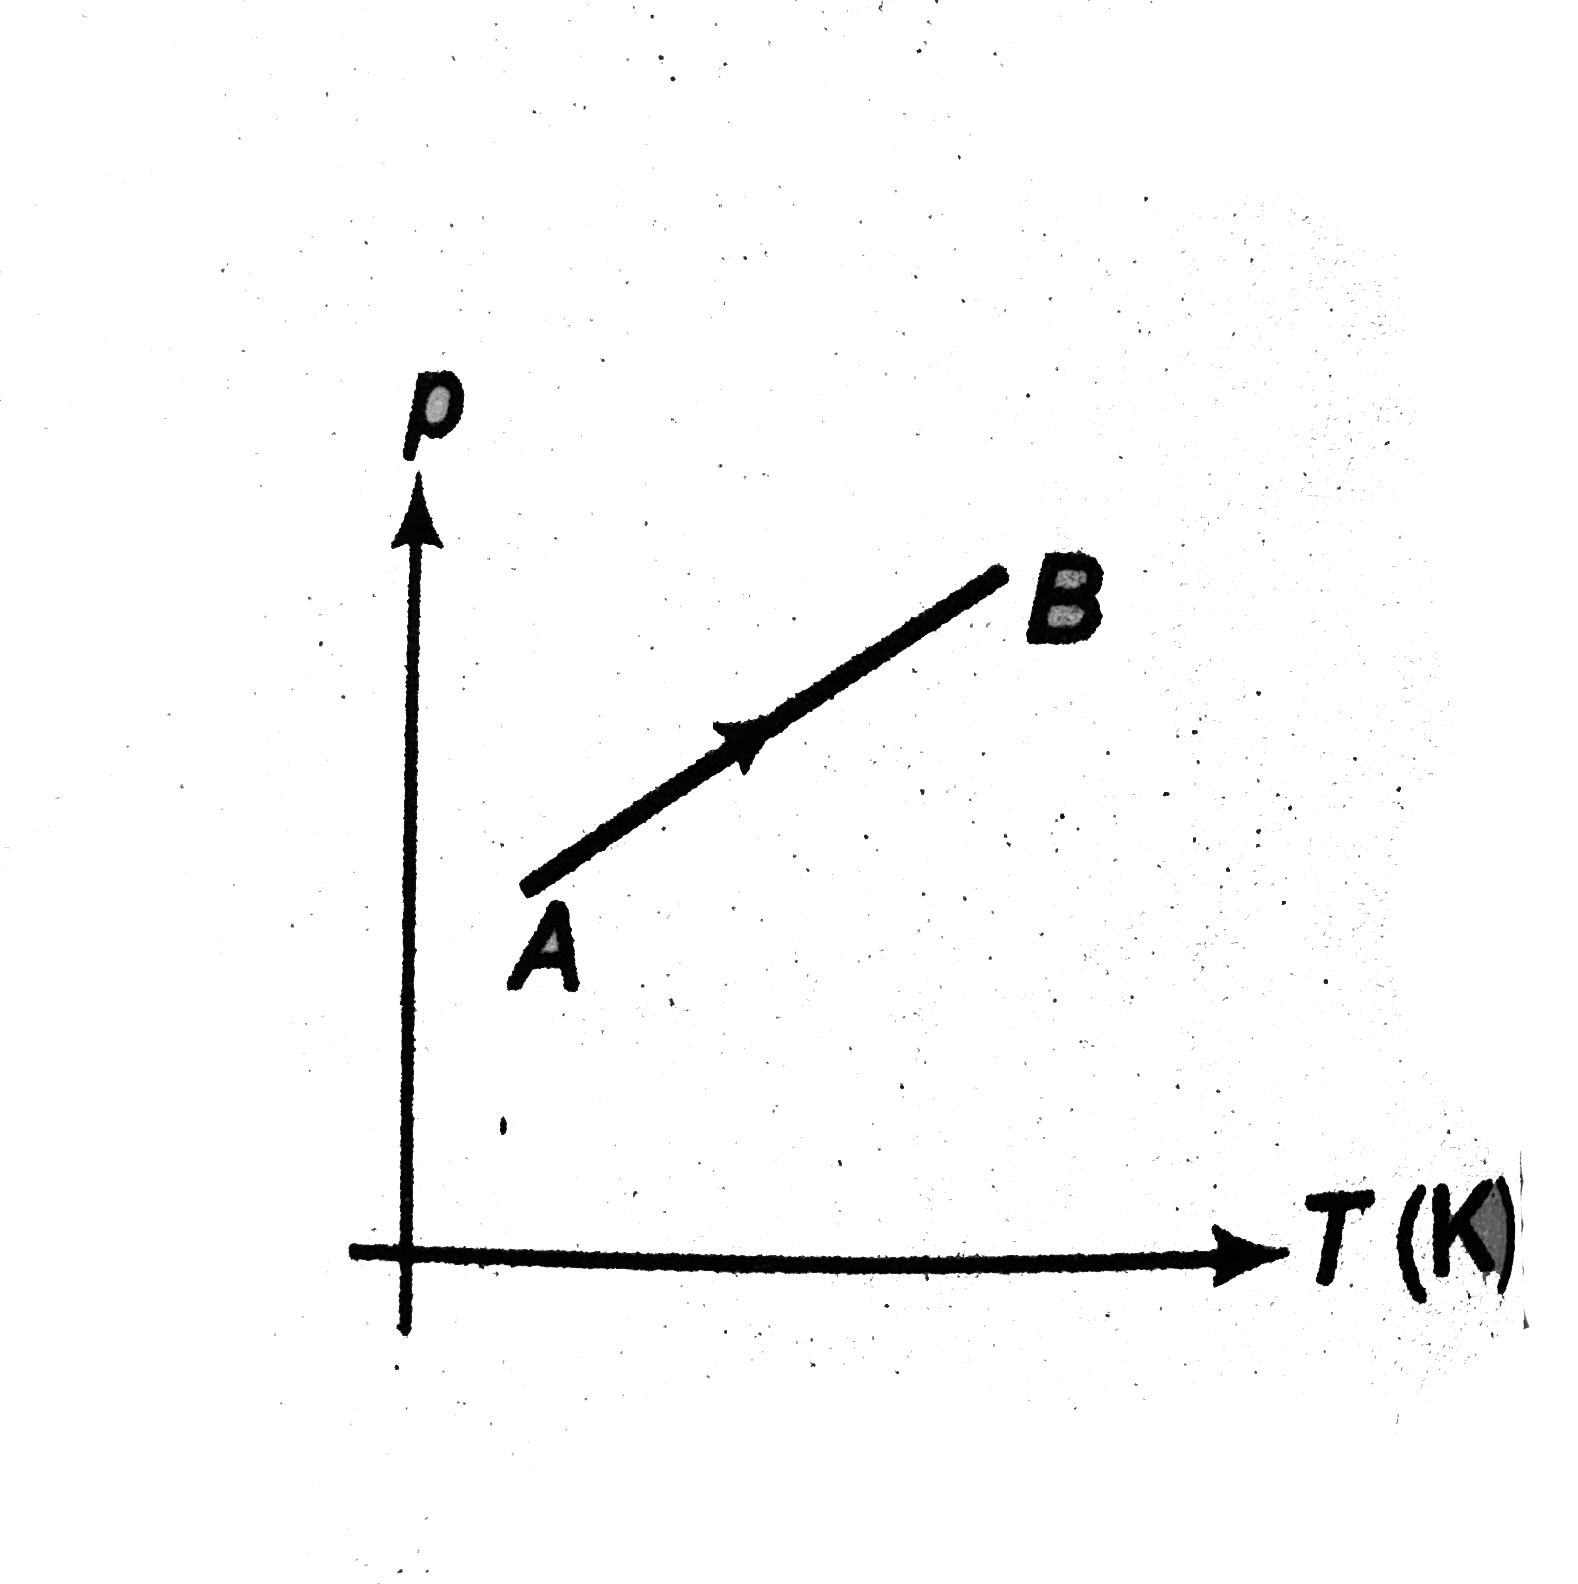
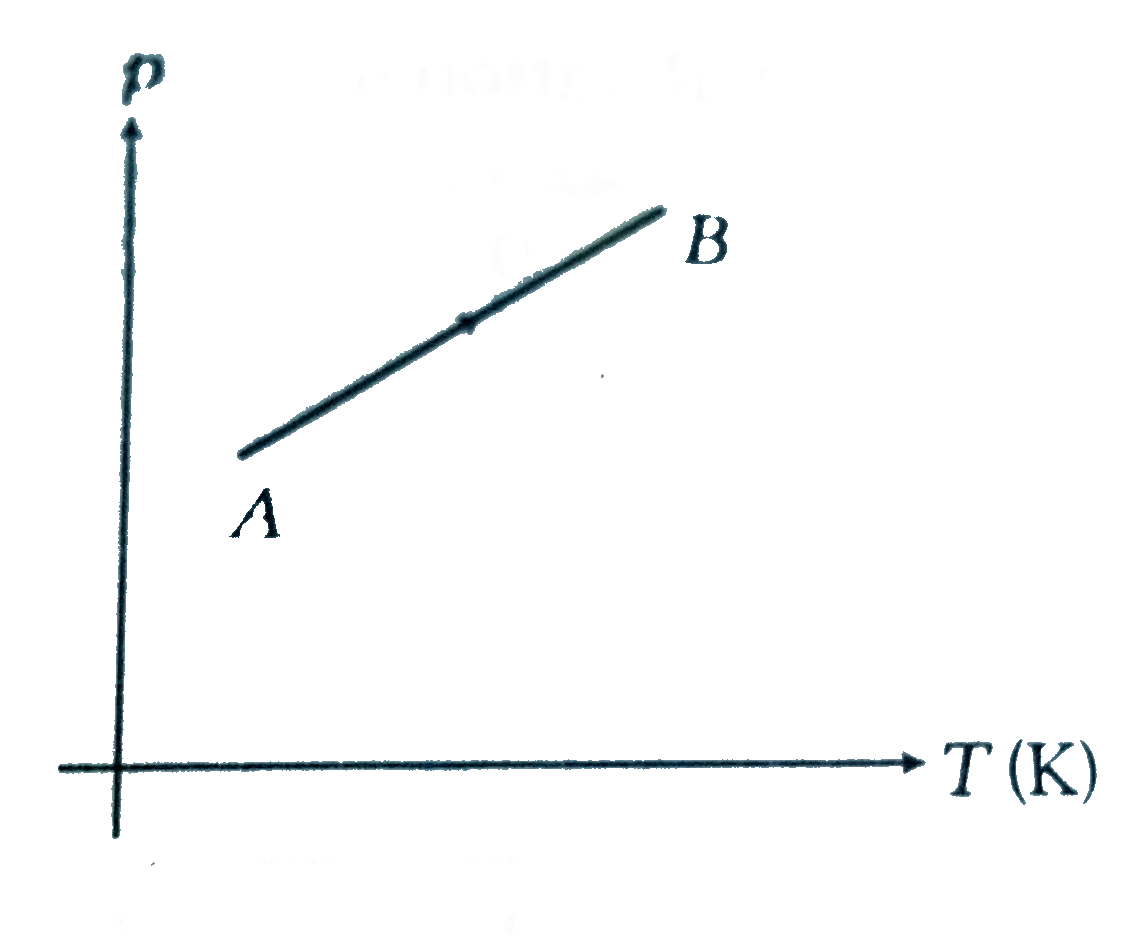
The p-T graph for the given mass of an ideal gas is shown in figure. What inference can be drawn regarding the change in volume (whether it is constant, increasing or decreasing) ?
How to proceed Definitely, it is not constant. Because when volume of the gas is constant p−T graph is a straight line passing through origin. The given line does not pass through origin, hence volume is not constant.  .
.
V=(nR)(TP)
Now, to see volume of the gas we will have to see whether TP is increasing or decreasing.
The correct Answer is:A, B
From the given graph, we can write the p−Tequation as
p=aT+b
Now, TB>TA
:. bTB<bTAor(PT)B<(PT)A
or (TP)B>(PT)A
or VB>VA
Thus, as we move from A to B, volume of the gas is increasimg.
Topper's Solved these Questions
- THERMOMETRY,THERMAL EXPANSION & KINETIC THEORY OF GASESBOOK - DC PANDEY ENGLISHCHAPTER - THERMOMETRY,THERMAL EXPANSION & KINETIC THEORY OF GASESEXERCISE - Example Type 1
1 Video
- THERMOMETRY,THERMAL EXPANSION & KINETIC THEORY OF GASESBOOK - DC PANDEY ENGLISHCHAPTER - THERMOMETRY,THERMAL EXPANSION & KINETIC THEORY OF GASESEXERCISE - Example Type 2
1 Video
- THERMOMETRY THERMAL EXPANSION AND KINETIC THEORY OF GASESBOOK - DC PANDEY ENGLISHCHAPTER - THERMOMETRY THERMAL EXPANSION AND KINETIC THEORY OF GASESEXERCISE - Medical entrance gallary
30 Videos
- UNIT AND DIMENSIONSBOOK - DC PANDEY ENGLISHCHAPTER - UNIT AND DIMENSIONSEXERCISE - Assertion And Reason
2 Videos
Similar Questions
The p−T graph for the given mass of an ideal gas is shown in figure. What inference can be drawn regarding the change in Volume (whtherit is constant, increasing or decreasing) ?

View SolutionAssertion : V = iR is Ohm's law.
Reason : V - I graph is always a straight line passing through origin.
View SolutionP-V diagram of a diatomic gas is a straight line passing through origin. The molar heat capacity of the gas in the process will be
View SolutionP-V diagram of a diatomic gas is a straight line passing through origin. The molar heat capacity of the gas in the process will be
View SolutionThe position-time graph of a moving particle is a straight line inclined with time axis and passing through origin, therefore
View SolutionThe pressure of a given mass of a gas contained in a vessel at constant temperature is reduced to half. Calculte the change in volume of the gas
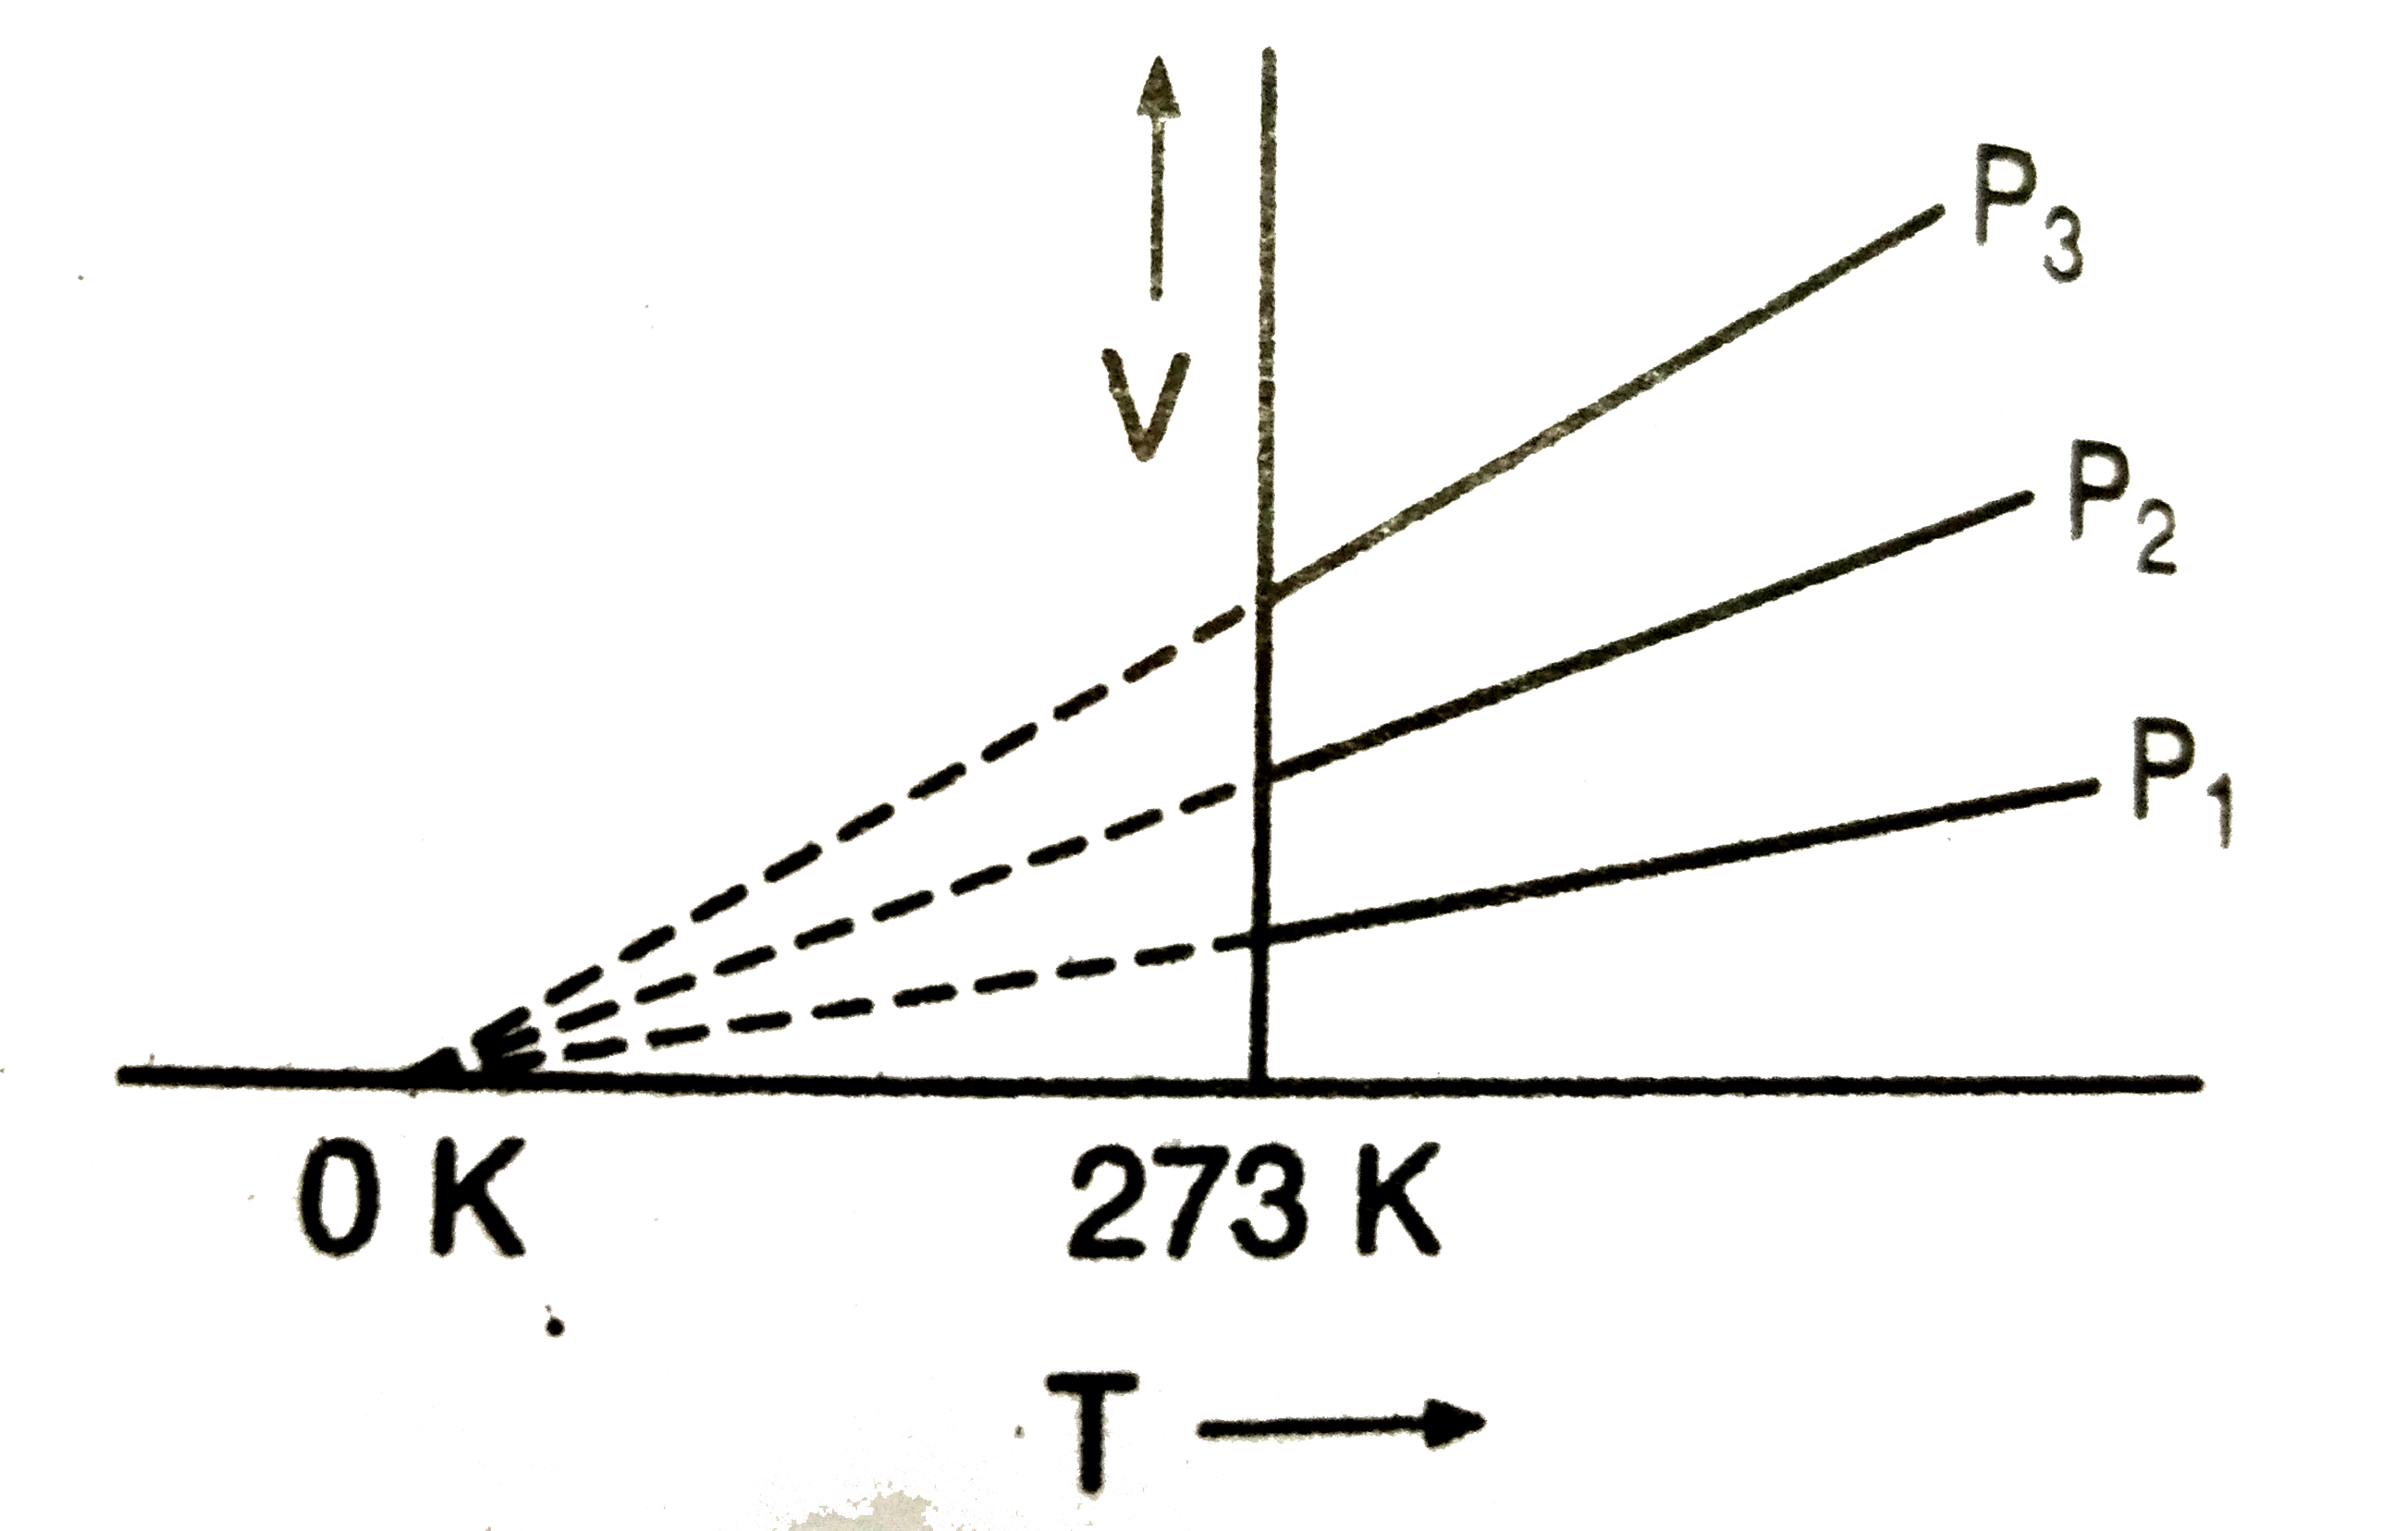
View SolutionThe volume-temperature graphs of a given mass of an ideal gas at constant pressure are shown below. What is the correct order of pressure ?

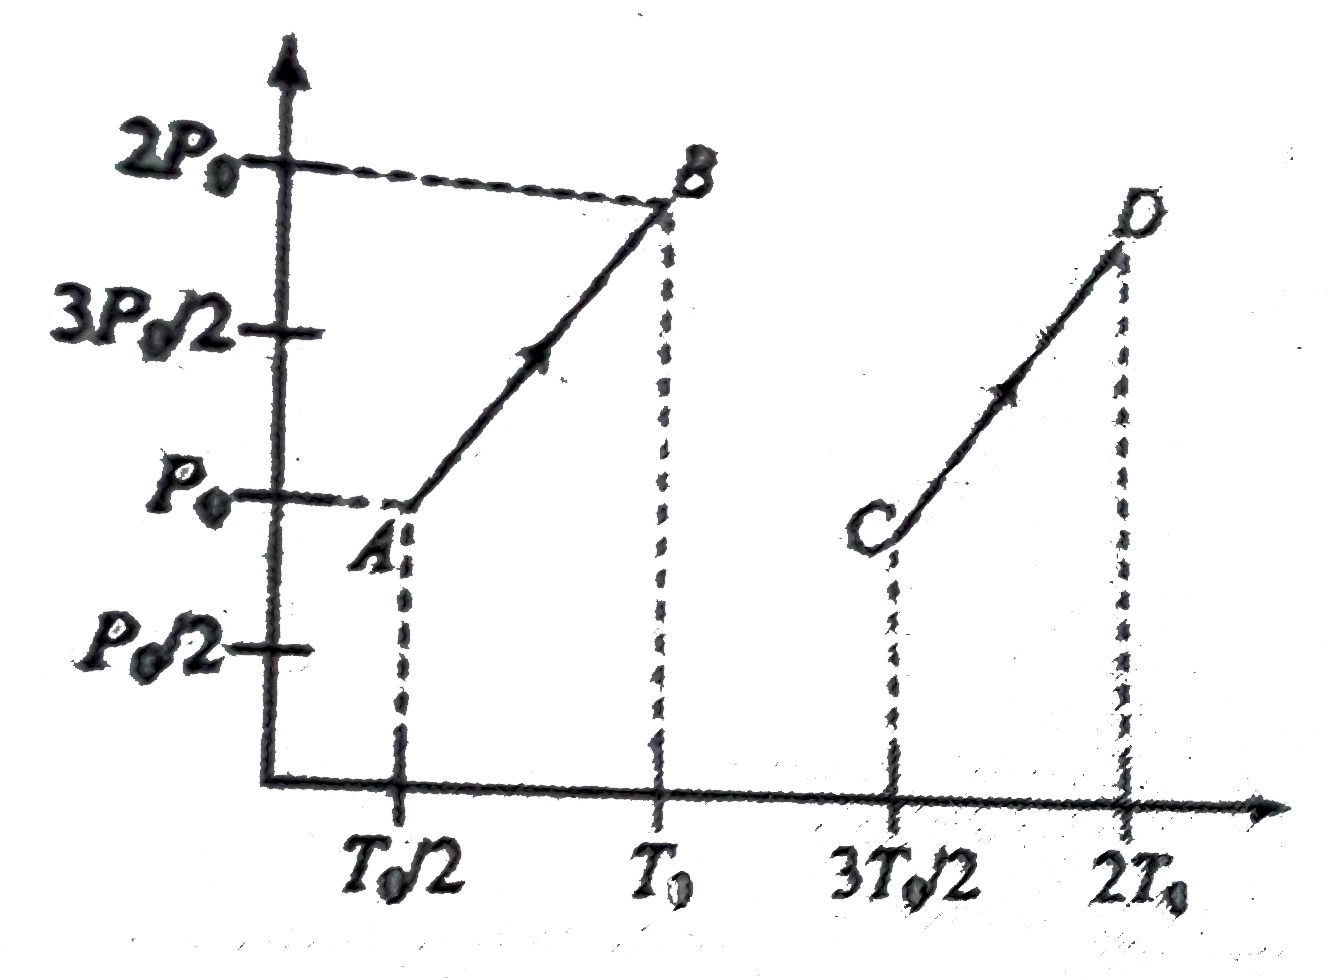
View SolutionP-T graph for same number of moles of two ideal gases are shown . Find the path along which volume decreases .

View SolutionThe volume of a given mass of a gas in a vessel is reduced to half at constant temperature what is the change in pressure?
View SolutionFor an ideal gas which of the following graphs will not be straight line when all the other variables are held constant?
View Solution

