The speed time graph for a car is shown in fig 8.12
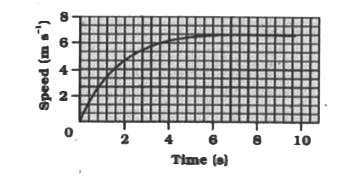
Which part of the graph represents uniform motion of the car?
The part of the graph in red color between time 6s to 10s represents uniform motion of the car.
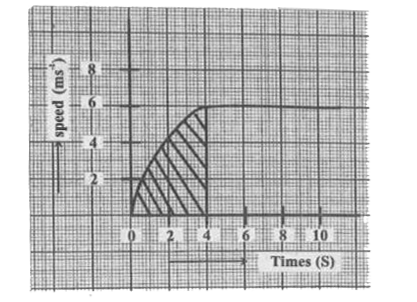
Similar Questions
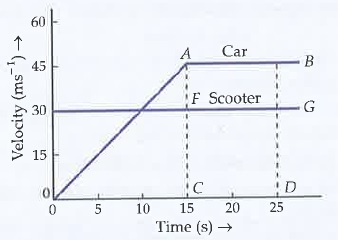
As soon as a car just starts from rest in a certain direction, a scooter moving with a uniform speed overtakes the car. Their velocity-time graphs are shown in Fig. 3.66. Calculate the time when the car will catch up the scooter.
View SolutionSpeed - time graph for a car is show in the fig 1.13:Which part of the graph represents uniform motion of the car ?
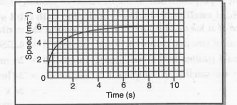
View SolutionThe speed-time graph for a car is shown in Fig.8.12. Find how far does the car travel in the first 4 seconds. Shade the area on the graph that represents the distance travelled by the car during the period.

View SolutionThe speed-time graph of a car is shown in figure given below Speed-time graph] (a) Find how far does the car travel in the first 4 second. Shade the area on the graph that represents the distance travelled by the car during the period. (b) Which part of the graph represents uniform motion of the car ?
View Solutionकिसी कार का चाल-समय ग्राफ चित्र में दर्शाया गया है चाल (m/s) -
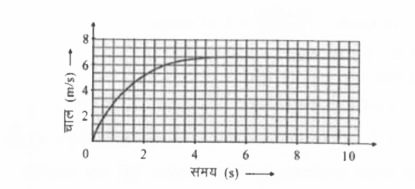
(1) पहले 4s में कार कितनी दूरी तय करती है ? इस अवधि में कार द्वारा तय की गई दूरी को ग्राफ में छायांकित क्षेत्र द्वारा दर्शाएँ।
(ii) ग्राफ का कौन-सा भाग कार की एकसमान गति को दर्शाता है ?
View SolutionThe speed time graph for a car is shown in the figure.
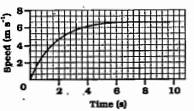
Which part of the graph represents uniform motion of the car?
View SolutionDraw a distance-time graph to show the motion of a car moving with a speed which is not constant (non-uniform speed).
View SolutionThe speed-time graph of a car is shown in figure given below Speed-time graph] (a) Find how far does the car travel in the first 4 second. Shade the area on the graph that represents the distance travelled by the car during the period. (b) Which part of the graph represents uniform motion of the car ?
View Solution
