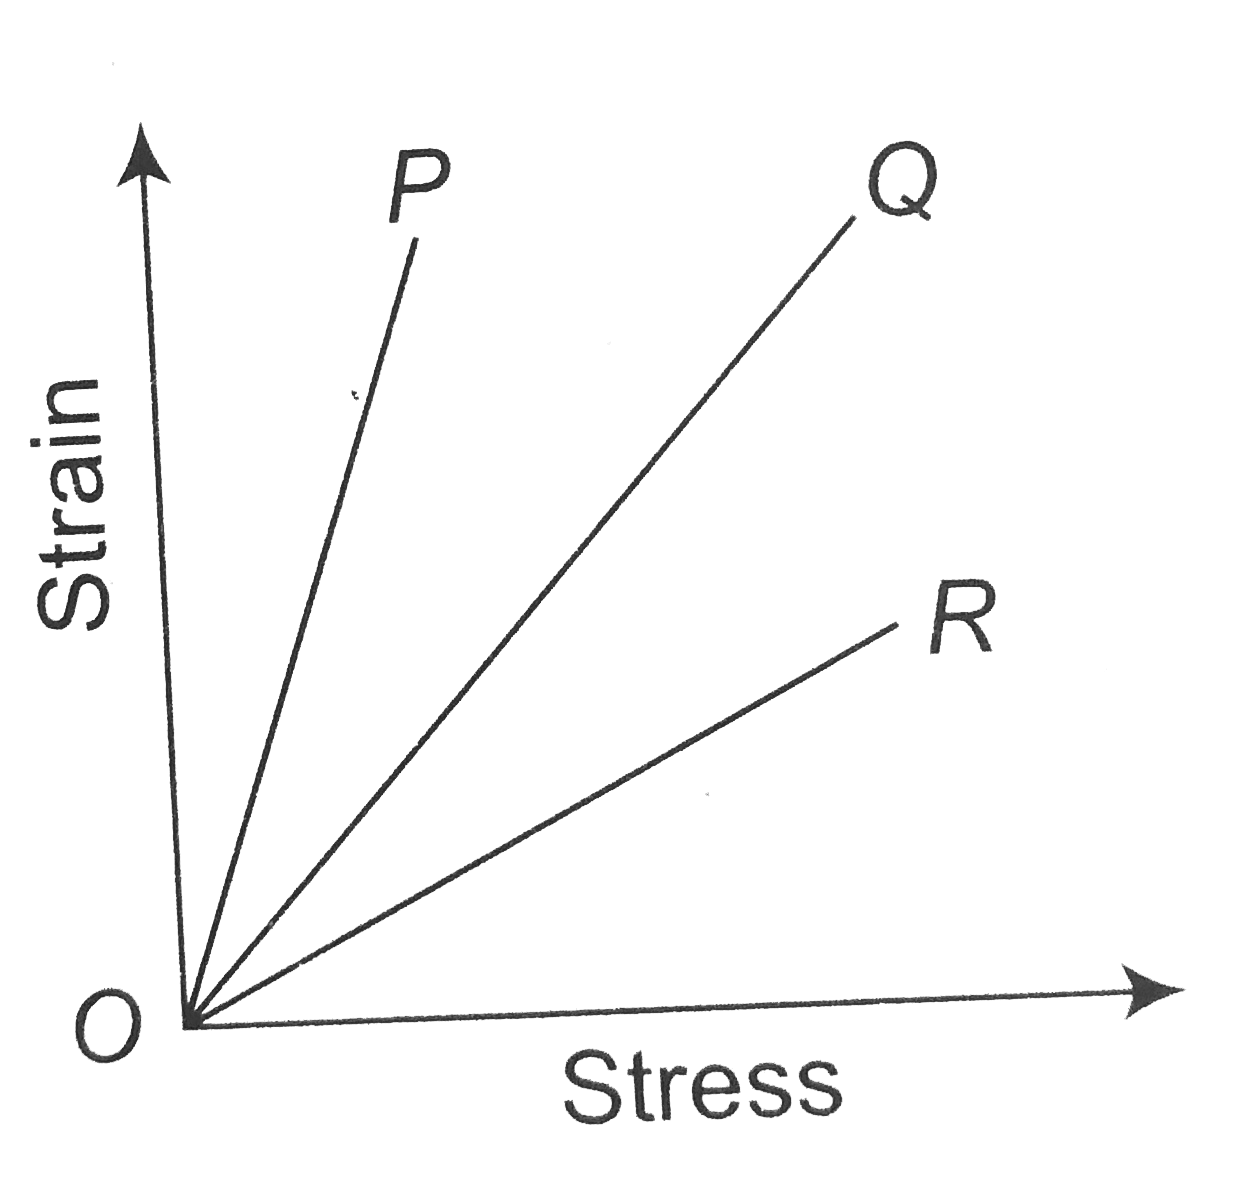
The strain stress curves of three wires of different materials are shown in the figure. P, Q and R are the elastic limits of the wires. The figure shown that
elasticity of wire P is maximum
elasticity of wire Q is maximum
tensile strength of wire R is maximum
None of the above
The correct Answer is:c
As stress is shown Y=cotθ=1tanθ=1slope
So, elasticity of wire P is minimum and or wire R is maximum.
Similar Questions
The stress versus strain graphs for wires of two materials A and B are as shown in the figure. If Y_A and Y_B are the Young's modulii of the materials, then
View SolutionThe strain stress curves of three wires of different material as shown in fig. A,B,C are the elastic limits of the wire. The figure show that
View SolutionWhich one of the following is the Young's modulus (in N//m^(2)) for the wire having the stress-strain curve shown in the figure?
View SolutionThe stress versus strain graphs for wires of two materials A and B are as shown in the figure. If YAandYB are the Young's modulli of the materials, then

View SolutionOn gradual loading , stress - strain relationship for a metal wire is as follows . Within proportionality limit , stress prop strain or, "Stress"/"strain" = a constant for the material of wire. If "Stress"/"Strain" is x in elastic region and y in the region of yield , then
View SolutionThe stress versus strain graphs for wires of two materials A and B are as shown in the figure. If Y_(A) and Y_(B) are the younng's moduli of the materials, then
View Solution
The strain stress curves of three wires of different materials are shown in the figure. P, Q and R are the elastic limits of the wires. The figure shown that
View SolutionThe stress versus strain graphs for wires of two materials A and B are as shown in the figure. If Y_(A) and Y_(B) are the younng's moduli of the materials, then
View Solution
