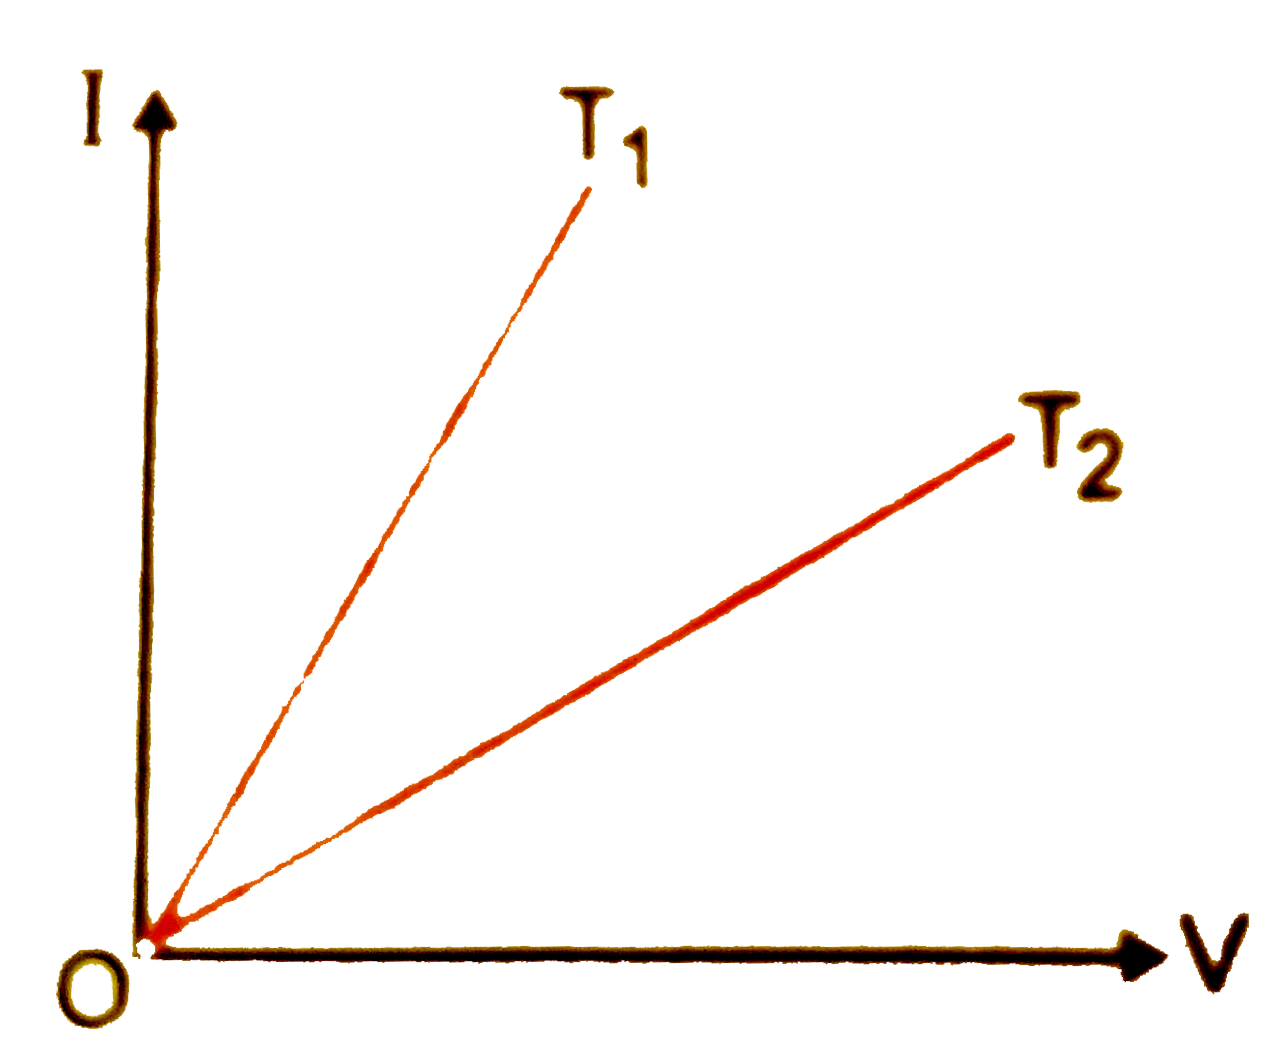
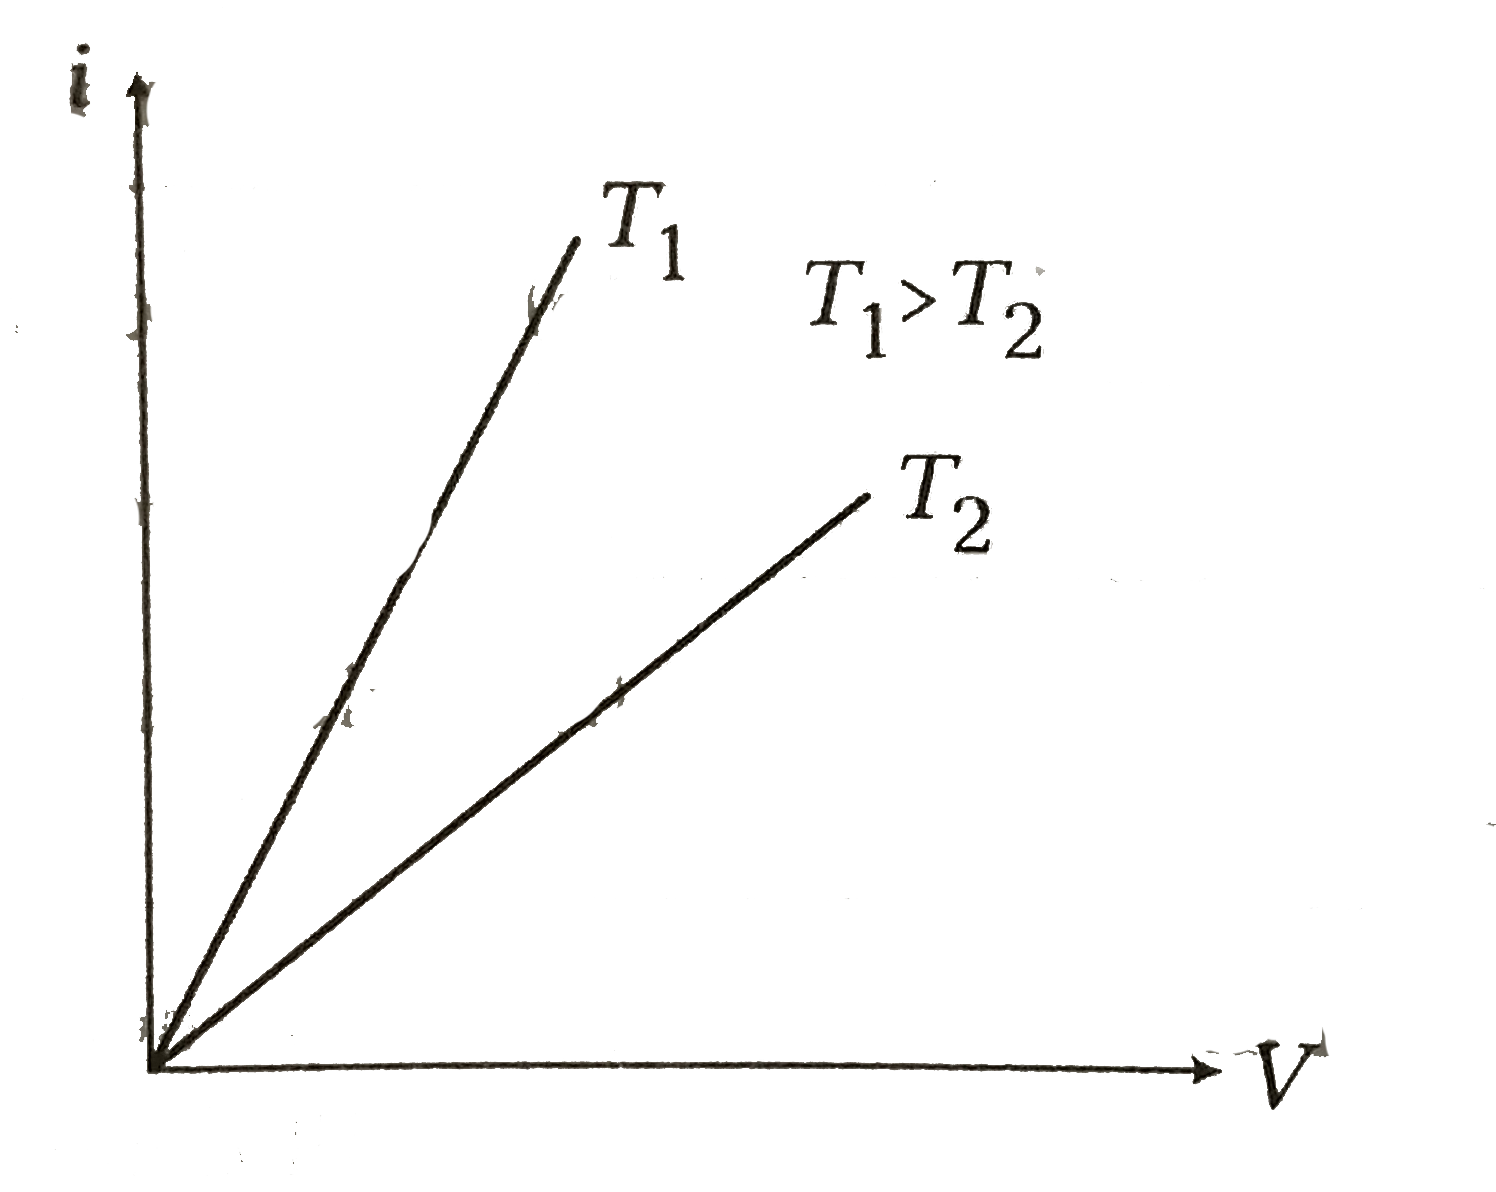
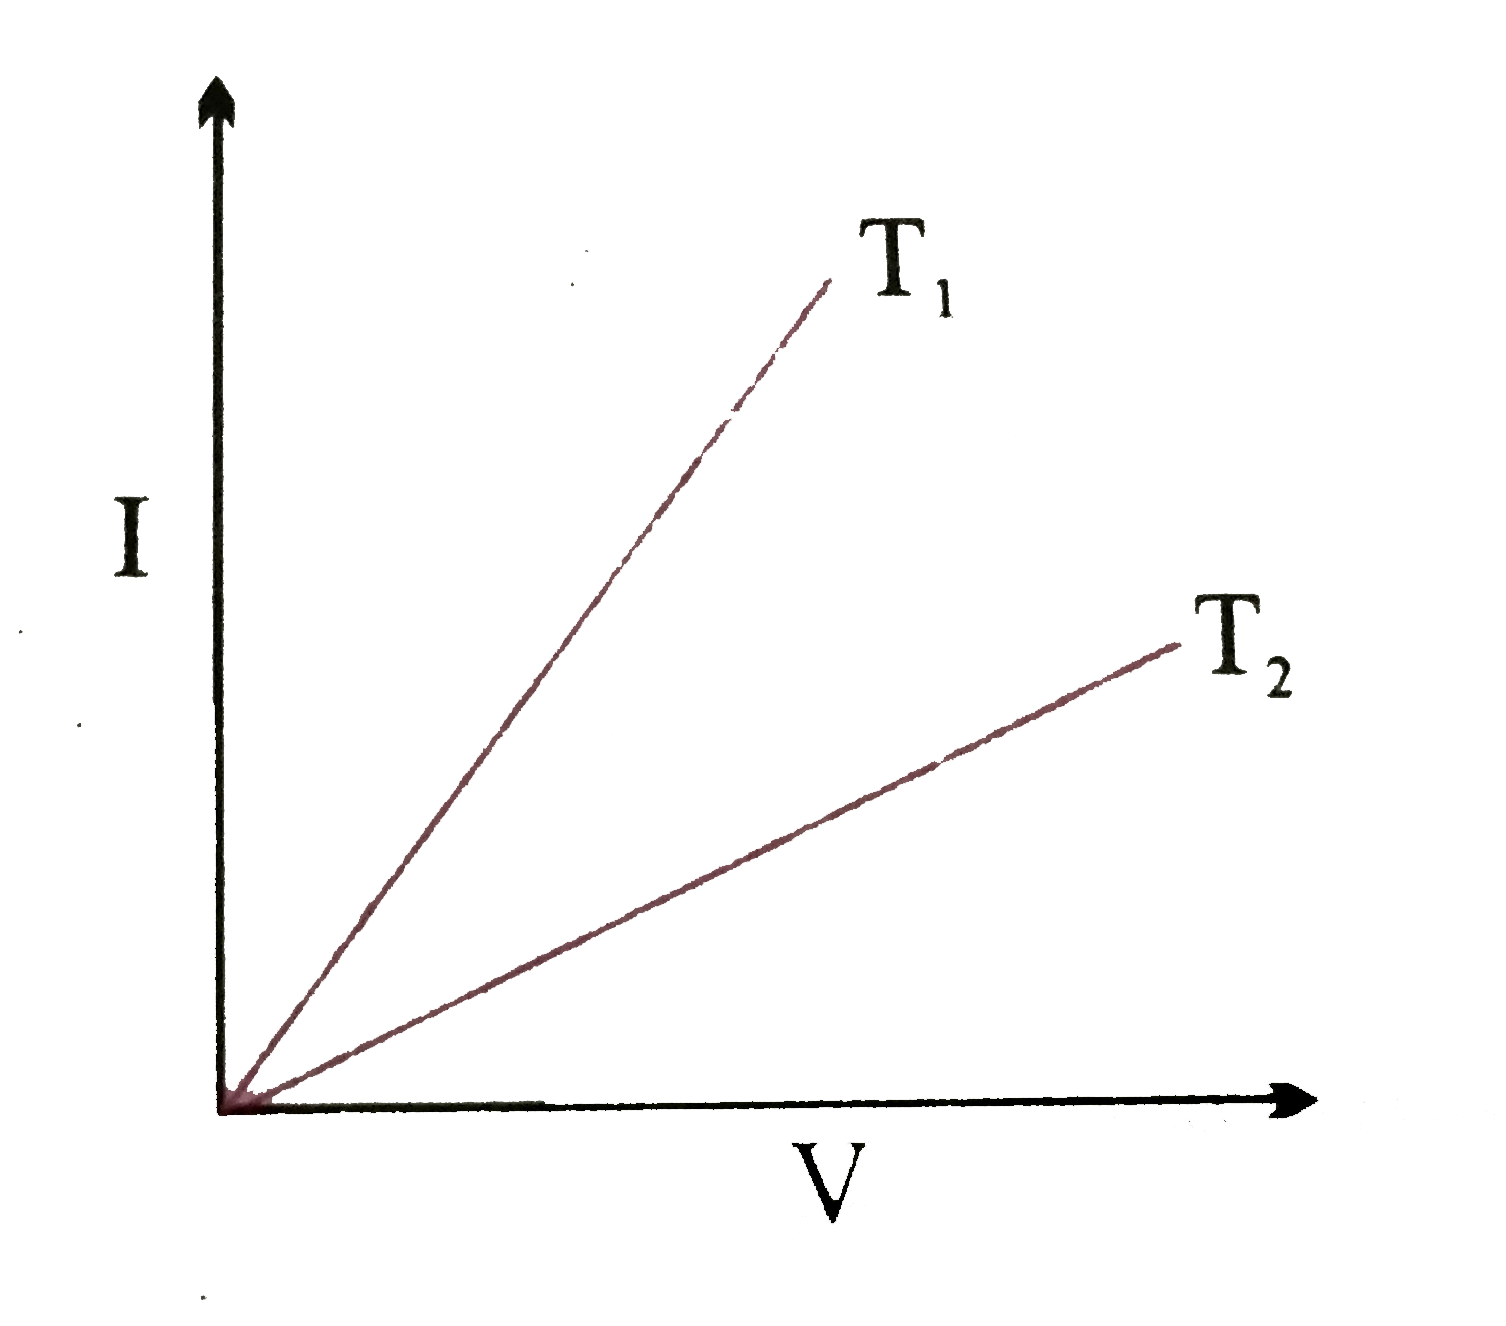
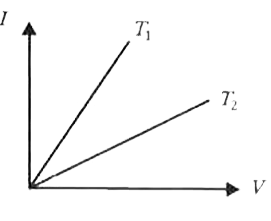
The V-I graph for a conductor at temperature T1andT2 are as shown in the figure. The term (T2−T1) is proportional to

cos2θ
sin2θ
cot2θ
tan2θ
The correct Answer is:C
The slope of V−I curve gives the resistance.
R1=tanθ=R0(1+αT1)andR2=cotθ=R0(1+αT2)
cotθ−tanθ=R0(1+αT2)−R0(1+αT1)=R0α(T2−T1)
or T2−T1=1αR0(cotθ−tanθ)
=1αR0(cosθsinθ−sinθcosθ)=2cos2θαR0sin2θ=2αR0cot2θ
or T2−T1∝cot2θ
Topper's Solved these Questions
- CURRENT ELECTRICITY BOOK - MTG GUIDECHAPTER - CURRENT ELECTRICITY EXERCISE - CHECK YOUR NEET VITALS
16 Videos
- CURRENT ELECTRICITY BOOK - MTG GUIDECHAPTER - CURRENT ELECTRICITY EXERCISE - MCQs AIPMT / NEET
32 Videos
- CURRENT ELECTRICITY BOOK - MTG GUIDECHAPTER - CURRENT ELECTRICITY EXERCISE - MCQs AIPMT / NEET
32 Videos
- ATOMS AND NUCLEIBOOK - MTG GUIDECHAPTER - ATOMS AND NUCLEIEXERCISE - AIPMT/NEET(MCQs)
40 Videos
- DUAL NATURE OF MATTER AND RADIATION BOOK - MTG GUIDECHAPTER - DUAL NATURE OF MATTER AND RADIATION EXERCISE - AIPMT/ NEET MCQs
30 Videos
Similar Questions
In an atom electrons revolves around the nucleus along a path of radius 0.72Ã… making 9.4×10¹⁸ revolution per second. The equivalent current is (e=1.6×10⁻¹⁹C)
View SolutionA potentiometer circuit is set up as shown. The potential gradient, across the potentiometer wire, is k volt/cm and the ammeter, present in the circuit, reads 1.0 A when two way key is swtiched off. The balance points, when the key between the terminals (i) 1 and 2 (ii)) 1 and 3, is plugged in, are found to be at lengths l1cmandl2cm respectively. The magnitudes, of the resistors R and X, in ohms, are equal, respectively, to

View SolutionA potentiometer circuit is set up as shown. The potential gradient, across the potentiometer wire, is k volt/cm and the ammeter, present in the circuit, reads 1.0 A when two way key is swtiched off. The balance points, when the key between the terminals (i) 1 and 2 (ii)) 1 and 3, is plugged in, are found to be at lengths l1cmandl2cm respectively. The magnitudes, of the resistors R and X, in ohms, are equal, respectively, to

View SolutionThe mass of a .73Li nucleus is 0.042u less than the sum of the masses of all its nucleons. The binding energy per nucleon of .73Li nucleus is nearly
View SolutionWhen monochromatic radiation of intensity I falls on a metal surface, the number of photoelectrons and their maximum kinetic are N and T respectively. If the intensity of radiation is 2 I, the number of emitted electrons and their maximum kinetic energy are respectively.
View SolutionV- I graph for a metallic wire at two different temperature T1 and T2 is shown in figure. Which of the two temperature is higher and why?

View SolutionThe figure shows the variation of V with i at temperatures T_(1) and T_(2) . Then T_(1)-T_(2) is proportional to
View SolutionThe voltage V and current I graph for a conductor at two different temperatures T_(1) and T_(2) are shown in the figure. The relation between T_(1) and T_(2) is
View SolutionThe V - i graph for a conductor at temperature T_(1) and T_(2) are as shown in the figure. ( T_(2) - T_(1)) is proportional to
View SolutionAssertion : Current versus potential difference (i-V) graph for a conductor at two different temperatures T1 and T2 is shown in figure. Hence T1>T2.

Reason : Resistance of a conductor increases with rise in temperature.
View SolutionThe V-l graph for a conductor at temperatures T_(1) " and " T_(2) are as shown in the figure. The term T_(2) -T_(1) is proportional to
View SolutionThe voltage V and current I v graphs for a conductor at two different temperatures T1andT2 are shown in the figure. The relation between T1andT2 is

View SolutionThe stress-strain graph for a metallic wire is shown at two different temperature, T_(1) and T_(2) which temperature is high T_(1) or T_(2) ?
View Solutionचित्र में विभवांतर V और धारा I के बीच किसी चालक के दो ताप T1और T2 पर ग्राफ दिखाए गये गये है । T1और T2 में सम्बन्ध होगा -

View SolutionThe current-voltage graph for a given metallic conductor at two different temperature T1andT2 are as shown in the figure. Then

View SolutionThe voltage V and current I graphs for a conductor at two different tempratures T_(1) and T_(2) are shown in the figure .The relation between T_(1) and T_(2) is
View Solution

