The variation between V-I has shown by graph for heating filament
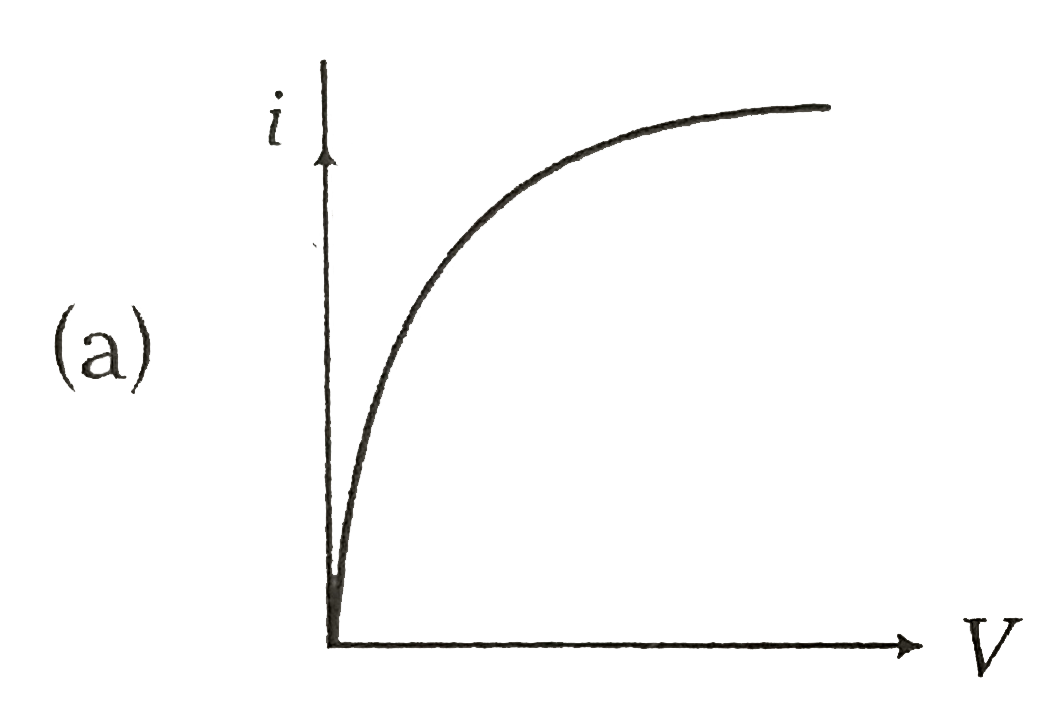
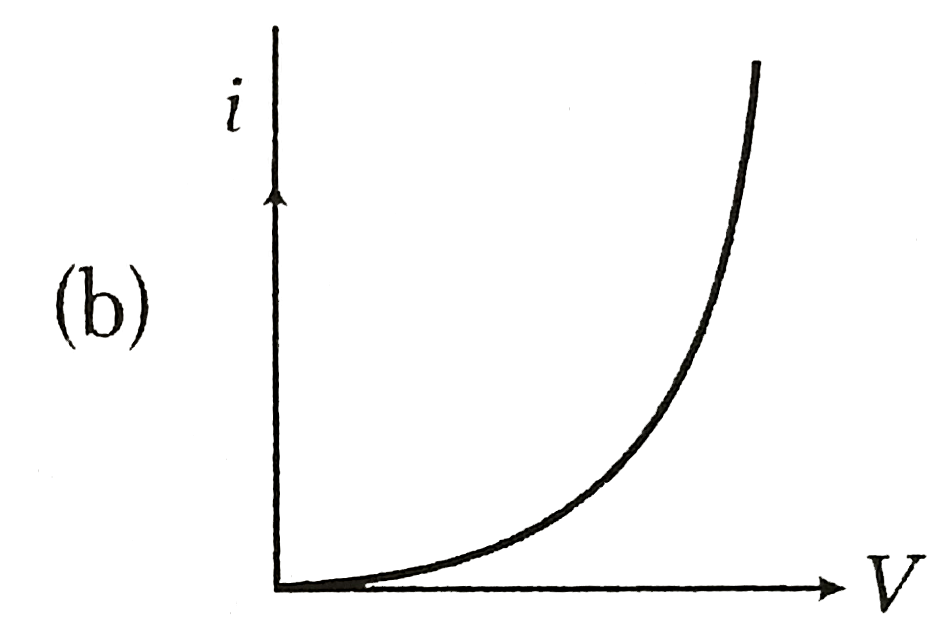

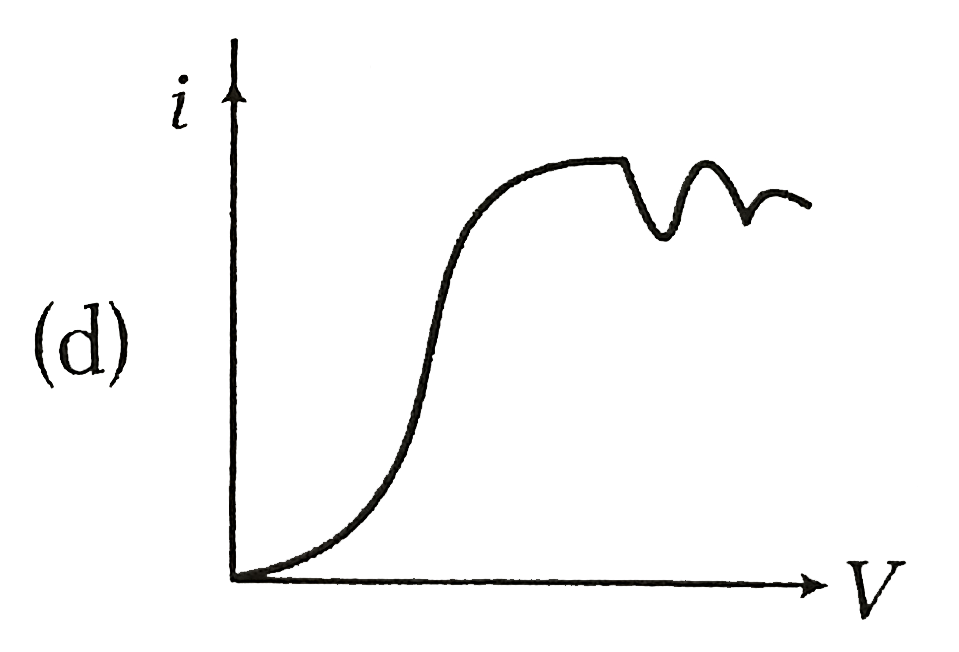
The correct Answer is:A
Step by step video solution for The variation between V-I has shown by graph for heating filament by Physics experts to help you in doubts & scoring excellent marks in Class 12 exams.
Updated on:21/07/2023टॉपर्स ने हल किए ये सवाल
- CURRENT ELECTRICITYBook:DC PANDEY ENGLISHChapter:CURRENT ELECTRICITYExercise:Match the columns
Explore 4 Videos
- COMMUNICATION SYSTEMBook:DC PANDEY ENGLISHChapter:COMMUNICATION SYSTEMExercise:Subjective
Explore 11 Videos
- ELECTROMAGNETIC INDUCTIONBook:DC PANDEY ENGLISHChapter:ELECTROMAGNETIC INDUCTIONExercise:Medical entrances gallery
Explore 25 Videos
समान प्रश्न
The variation of current with time in a wire was shown in graph given below. Find amount of charge flowing in 6sec
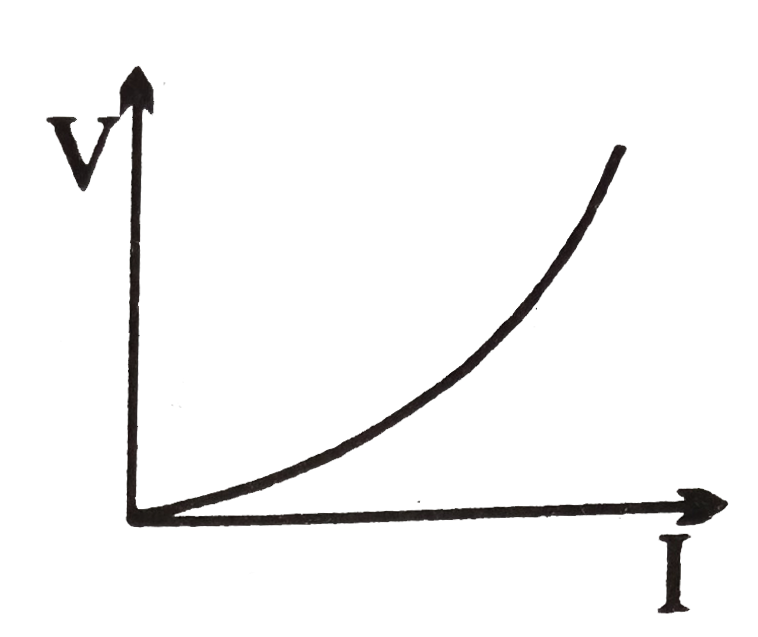
View SolutionThe variation of current (I) and voltage (V) is as shown in figure A. The variation of power P with current I is best shown by which of the following graph
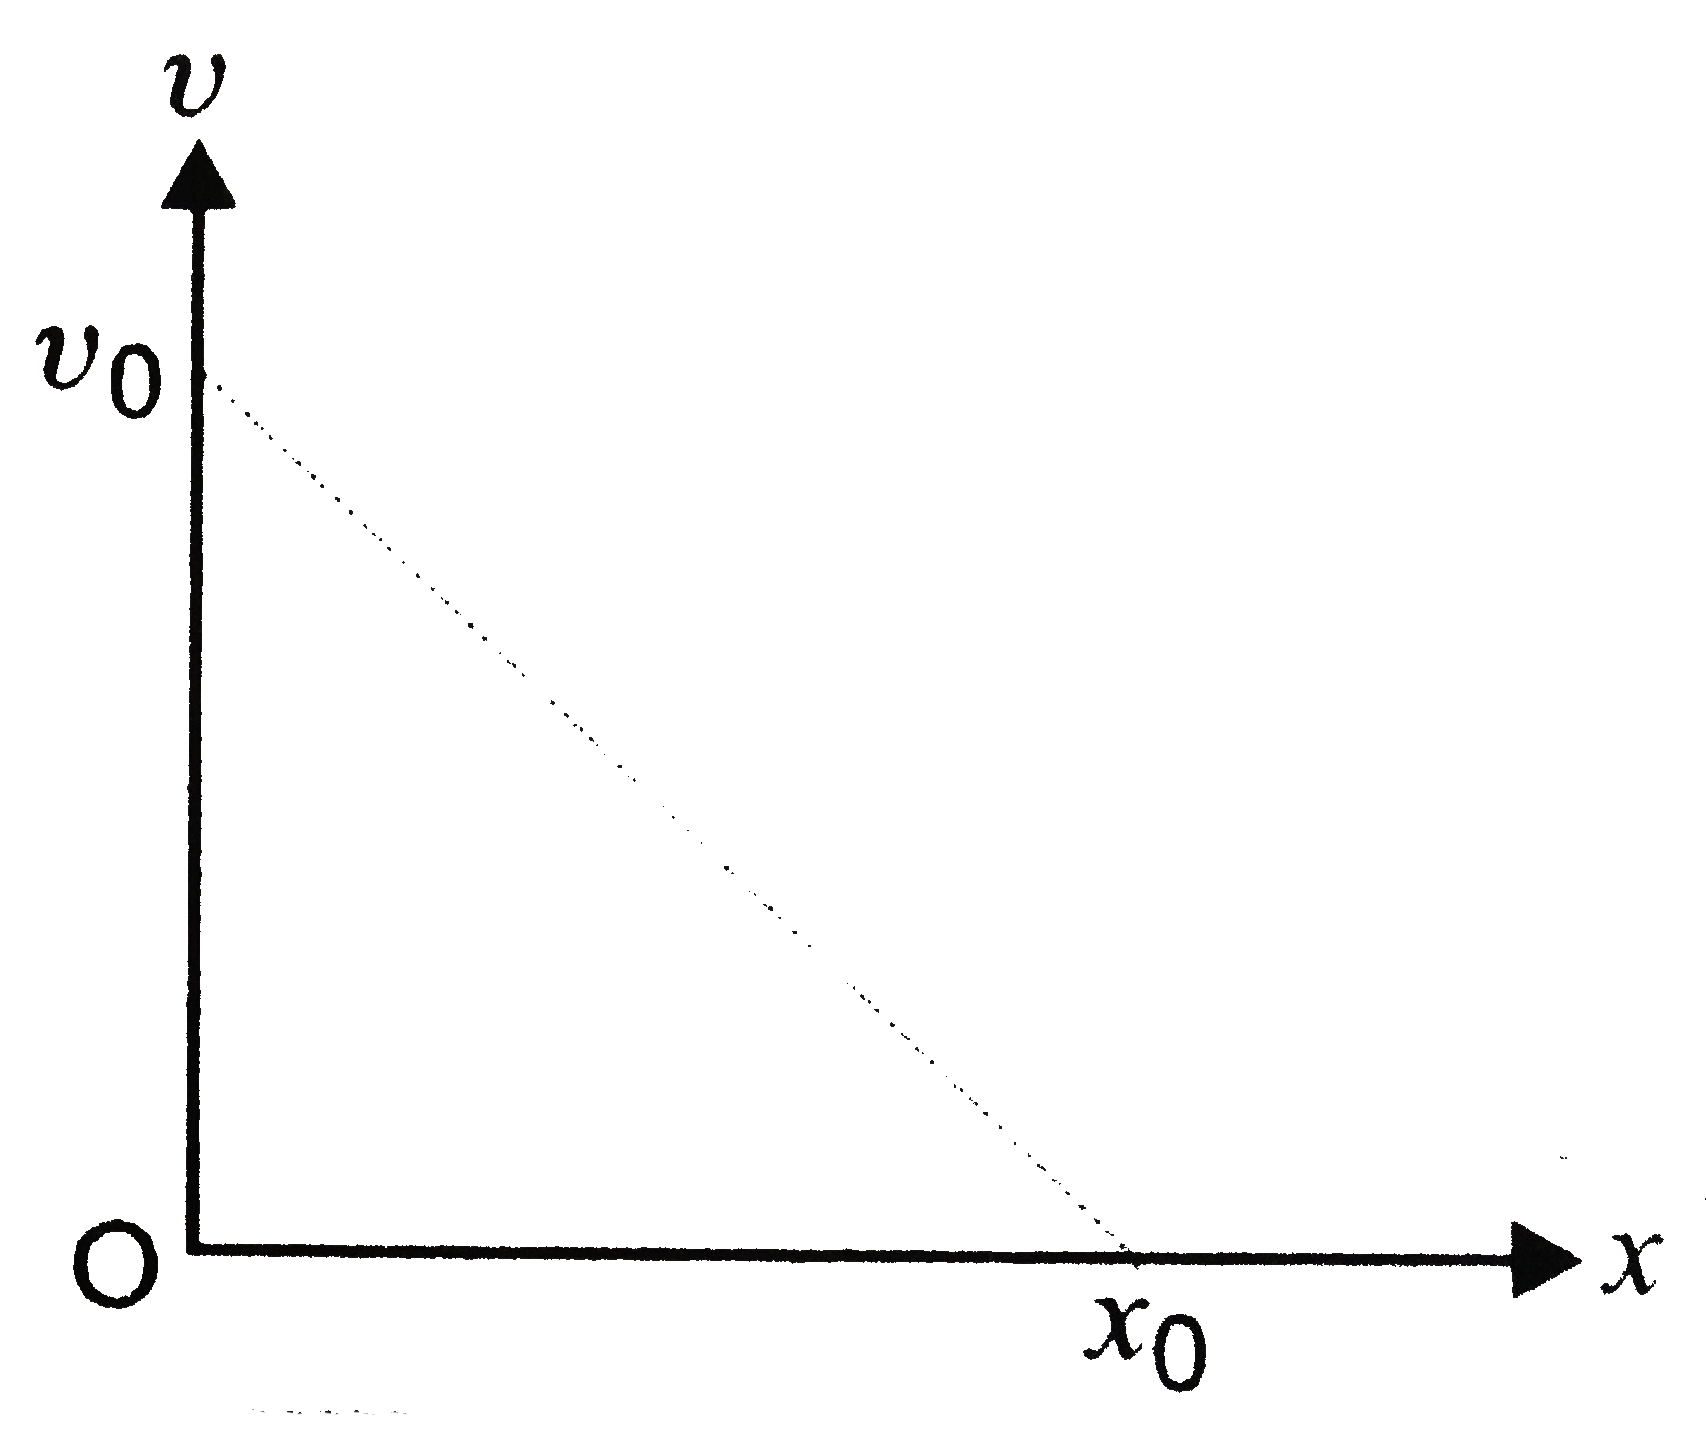
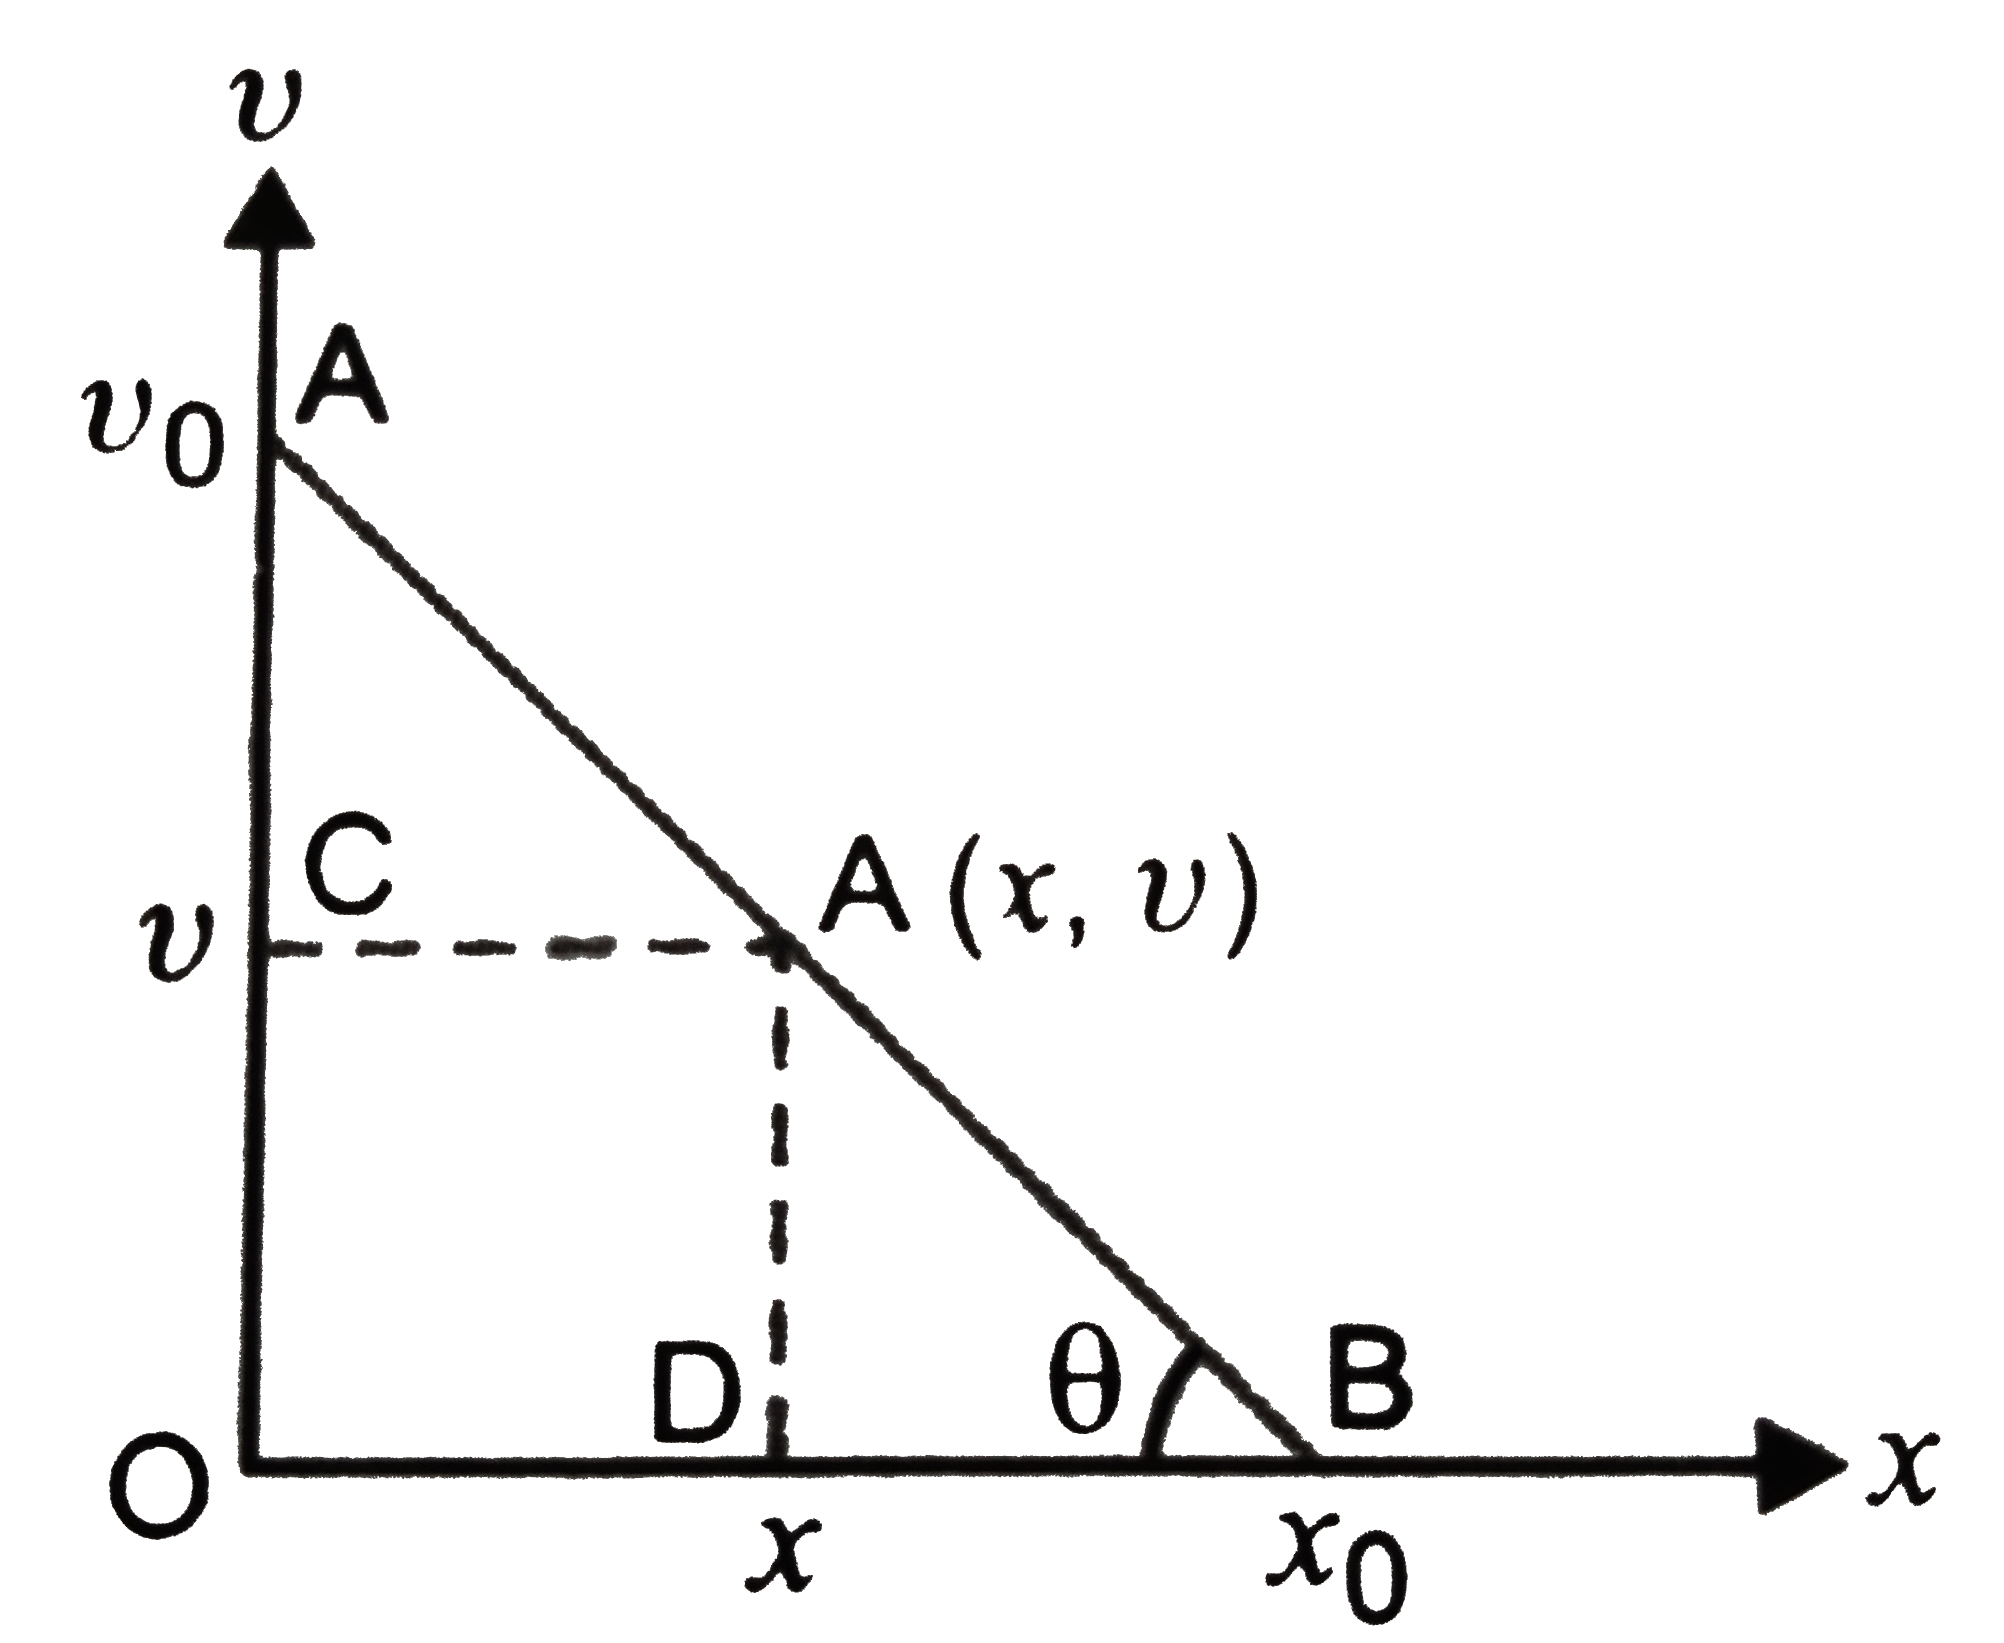
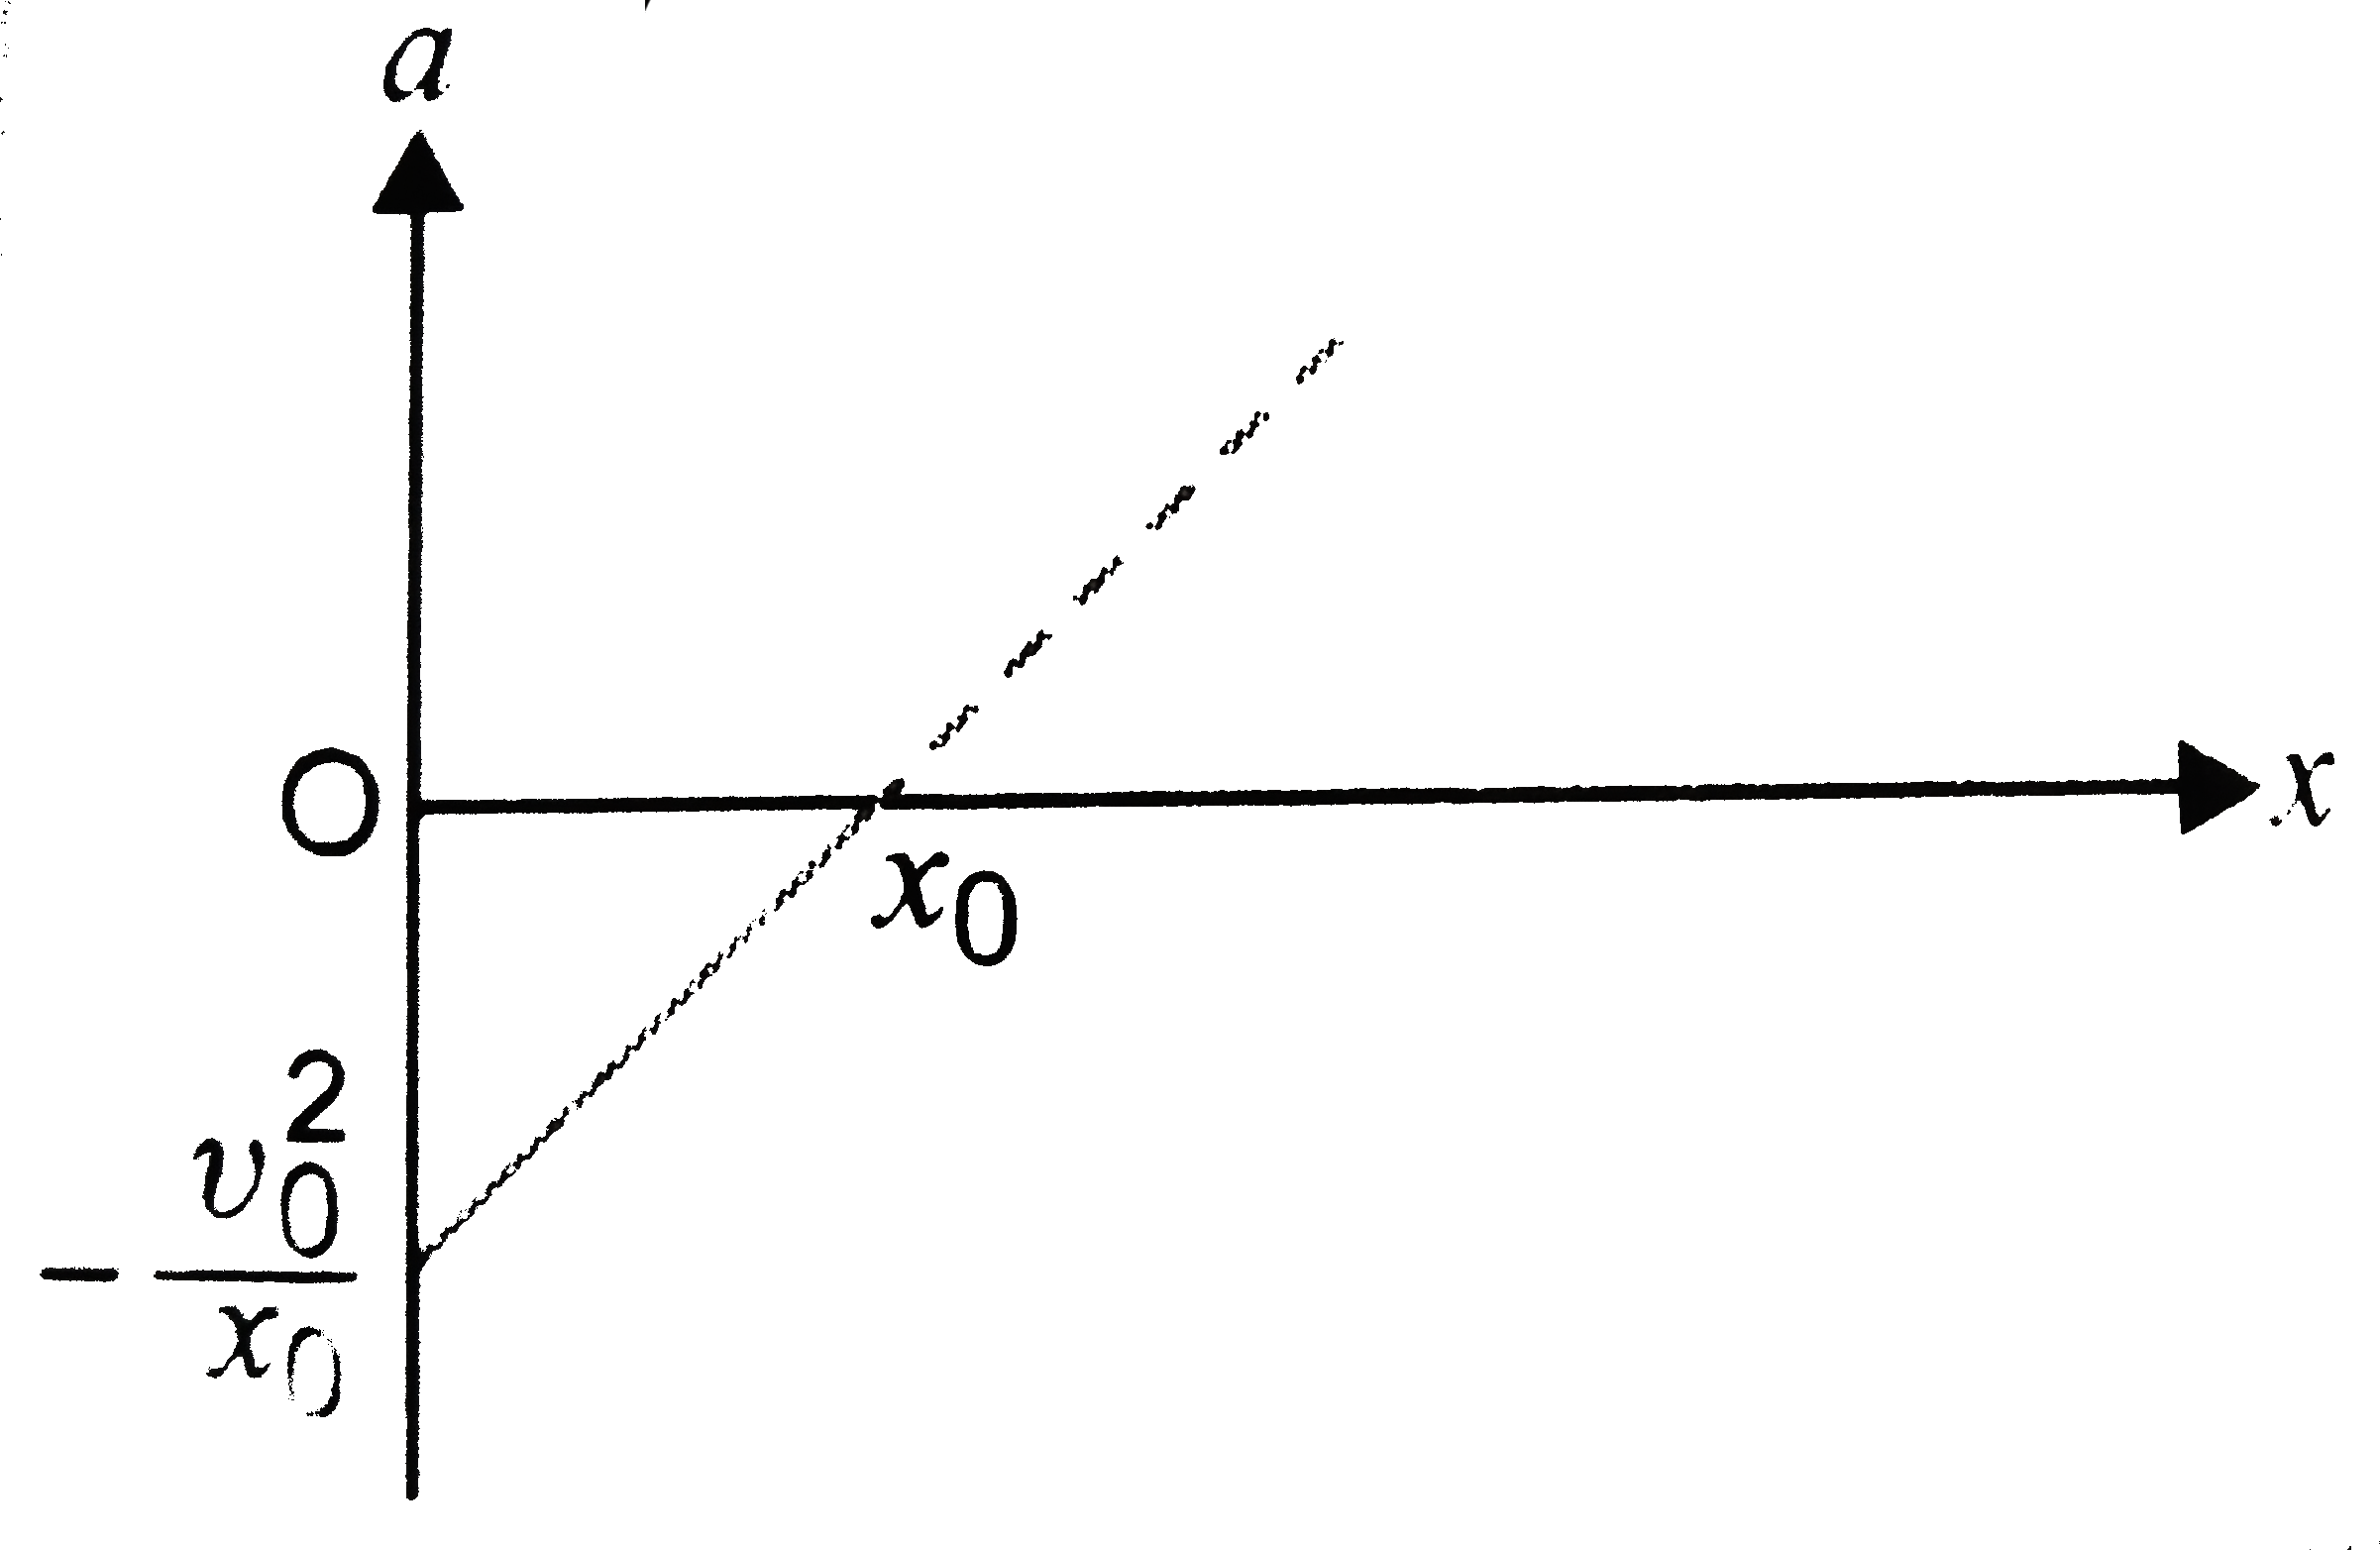
View SolutionThe velocity-displacement graph of a particle is shown in Fig . (a) Write the relation between (v) and (x).
(b) Obtain the relation between acceleration and displacement and plot it .
 .
.
 .
.
 .
.
View SolutionThe curves (a),(b),(c) and (d) show the variation between the applied potential difference (V) and the photoelectric current (i) , at two different intensities of light (I1>I2). In which figure is the correct variation shown ?
View SolutionA piece of ice is heated at a constant rate. The variation in temperature with time of heating is shown in the graph in Fig. 11.6.
(i) What is represented by the part AB ?
(ii) What does the part CD represent ?
(iii) What conclusion do you draw regarding the nature of ice from the graph ?
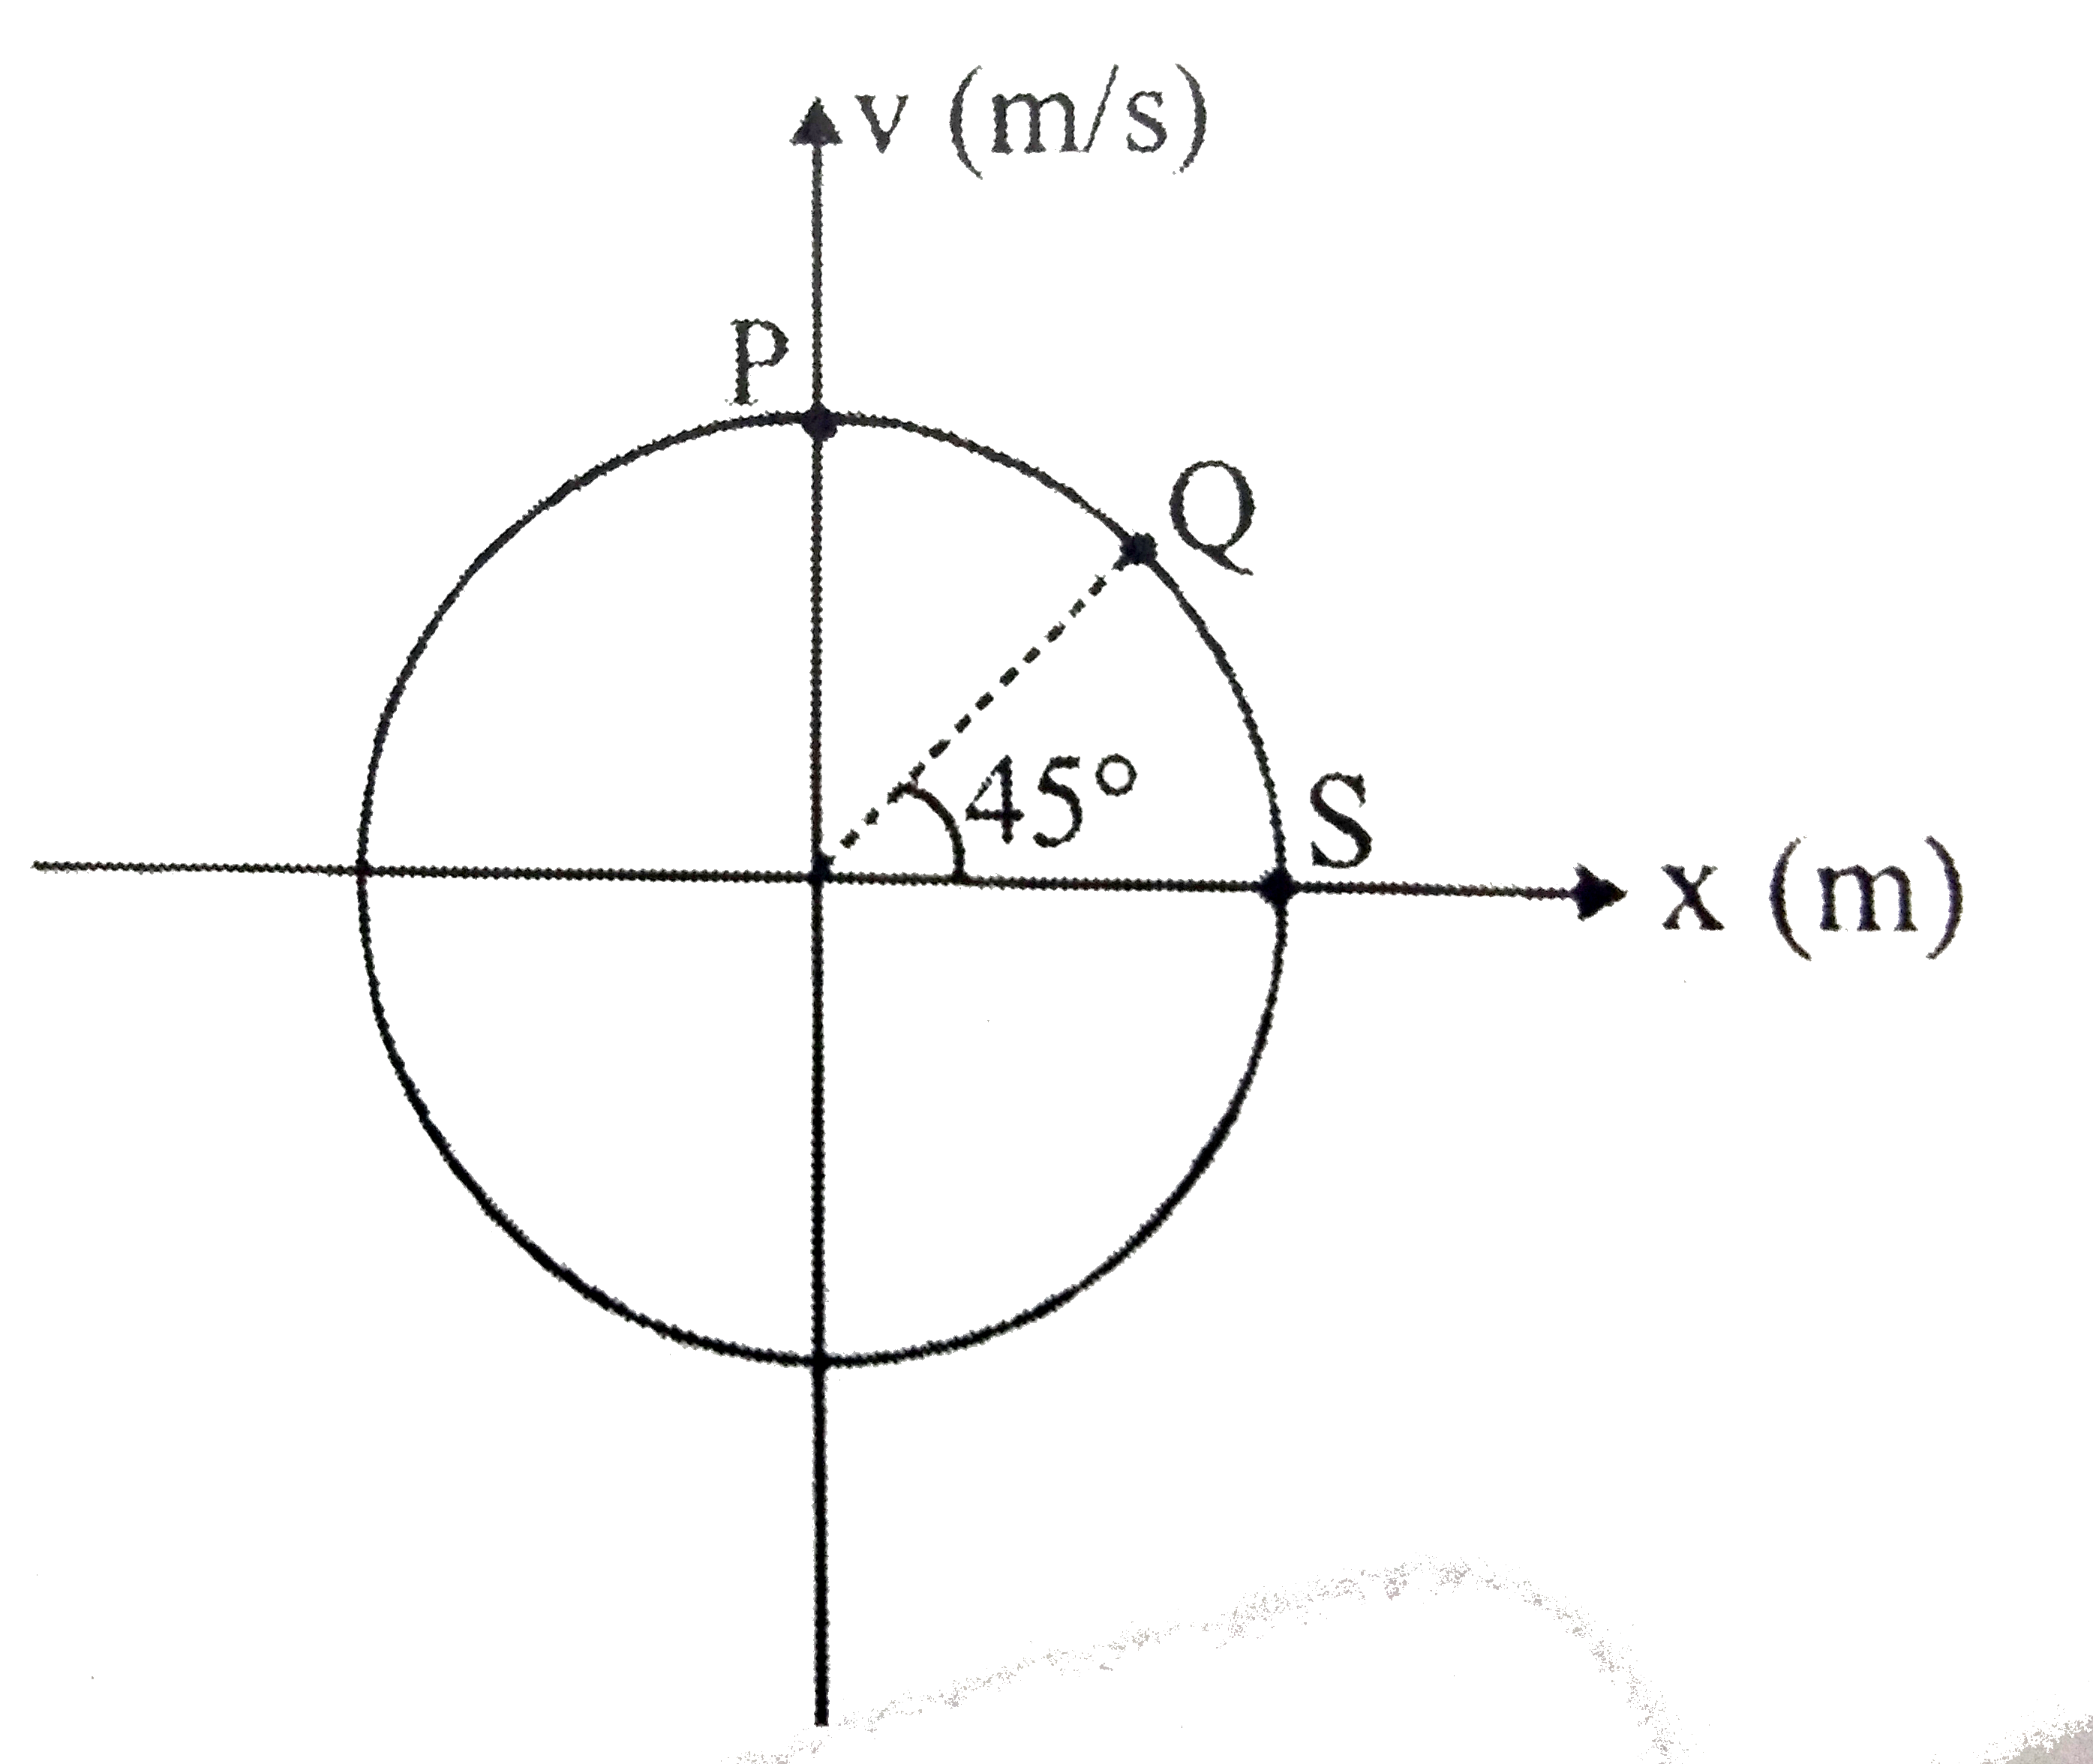
View SolutionA particle is in motion on the x-axis. The variation ofits velocity with position is as shown. The graph is circle and its equation is x2+v2=1, where x is in m and v in m/s. The correct statement(s) is/are:-
View SolutionFollowing graphs shows the variation in the intensity of heat radiations by the the black body and frequency at a fixed temperature . Choose the correct option.
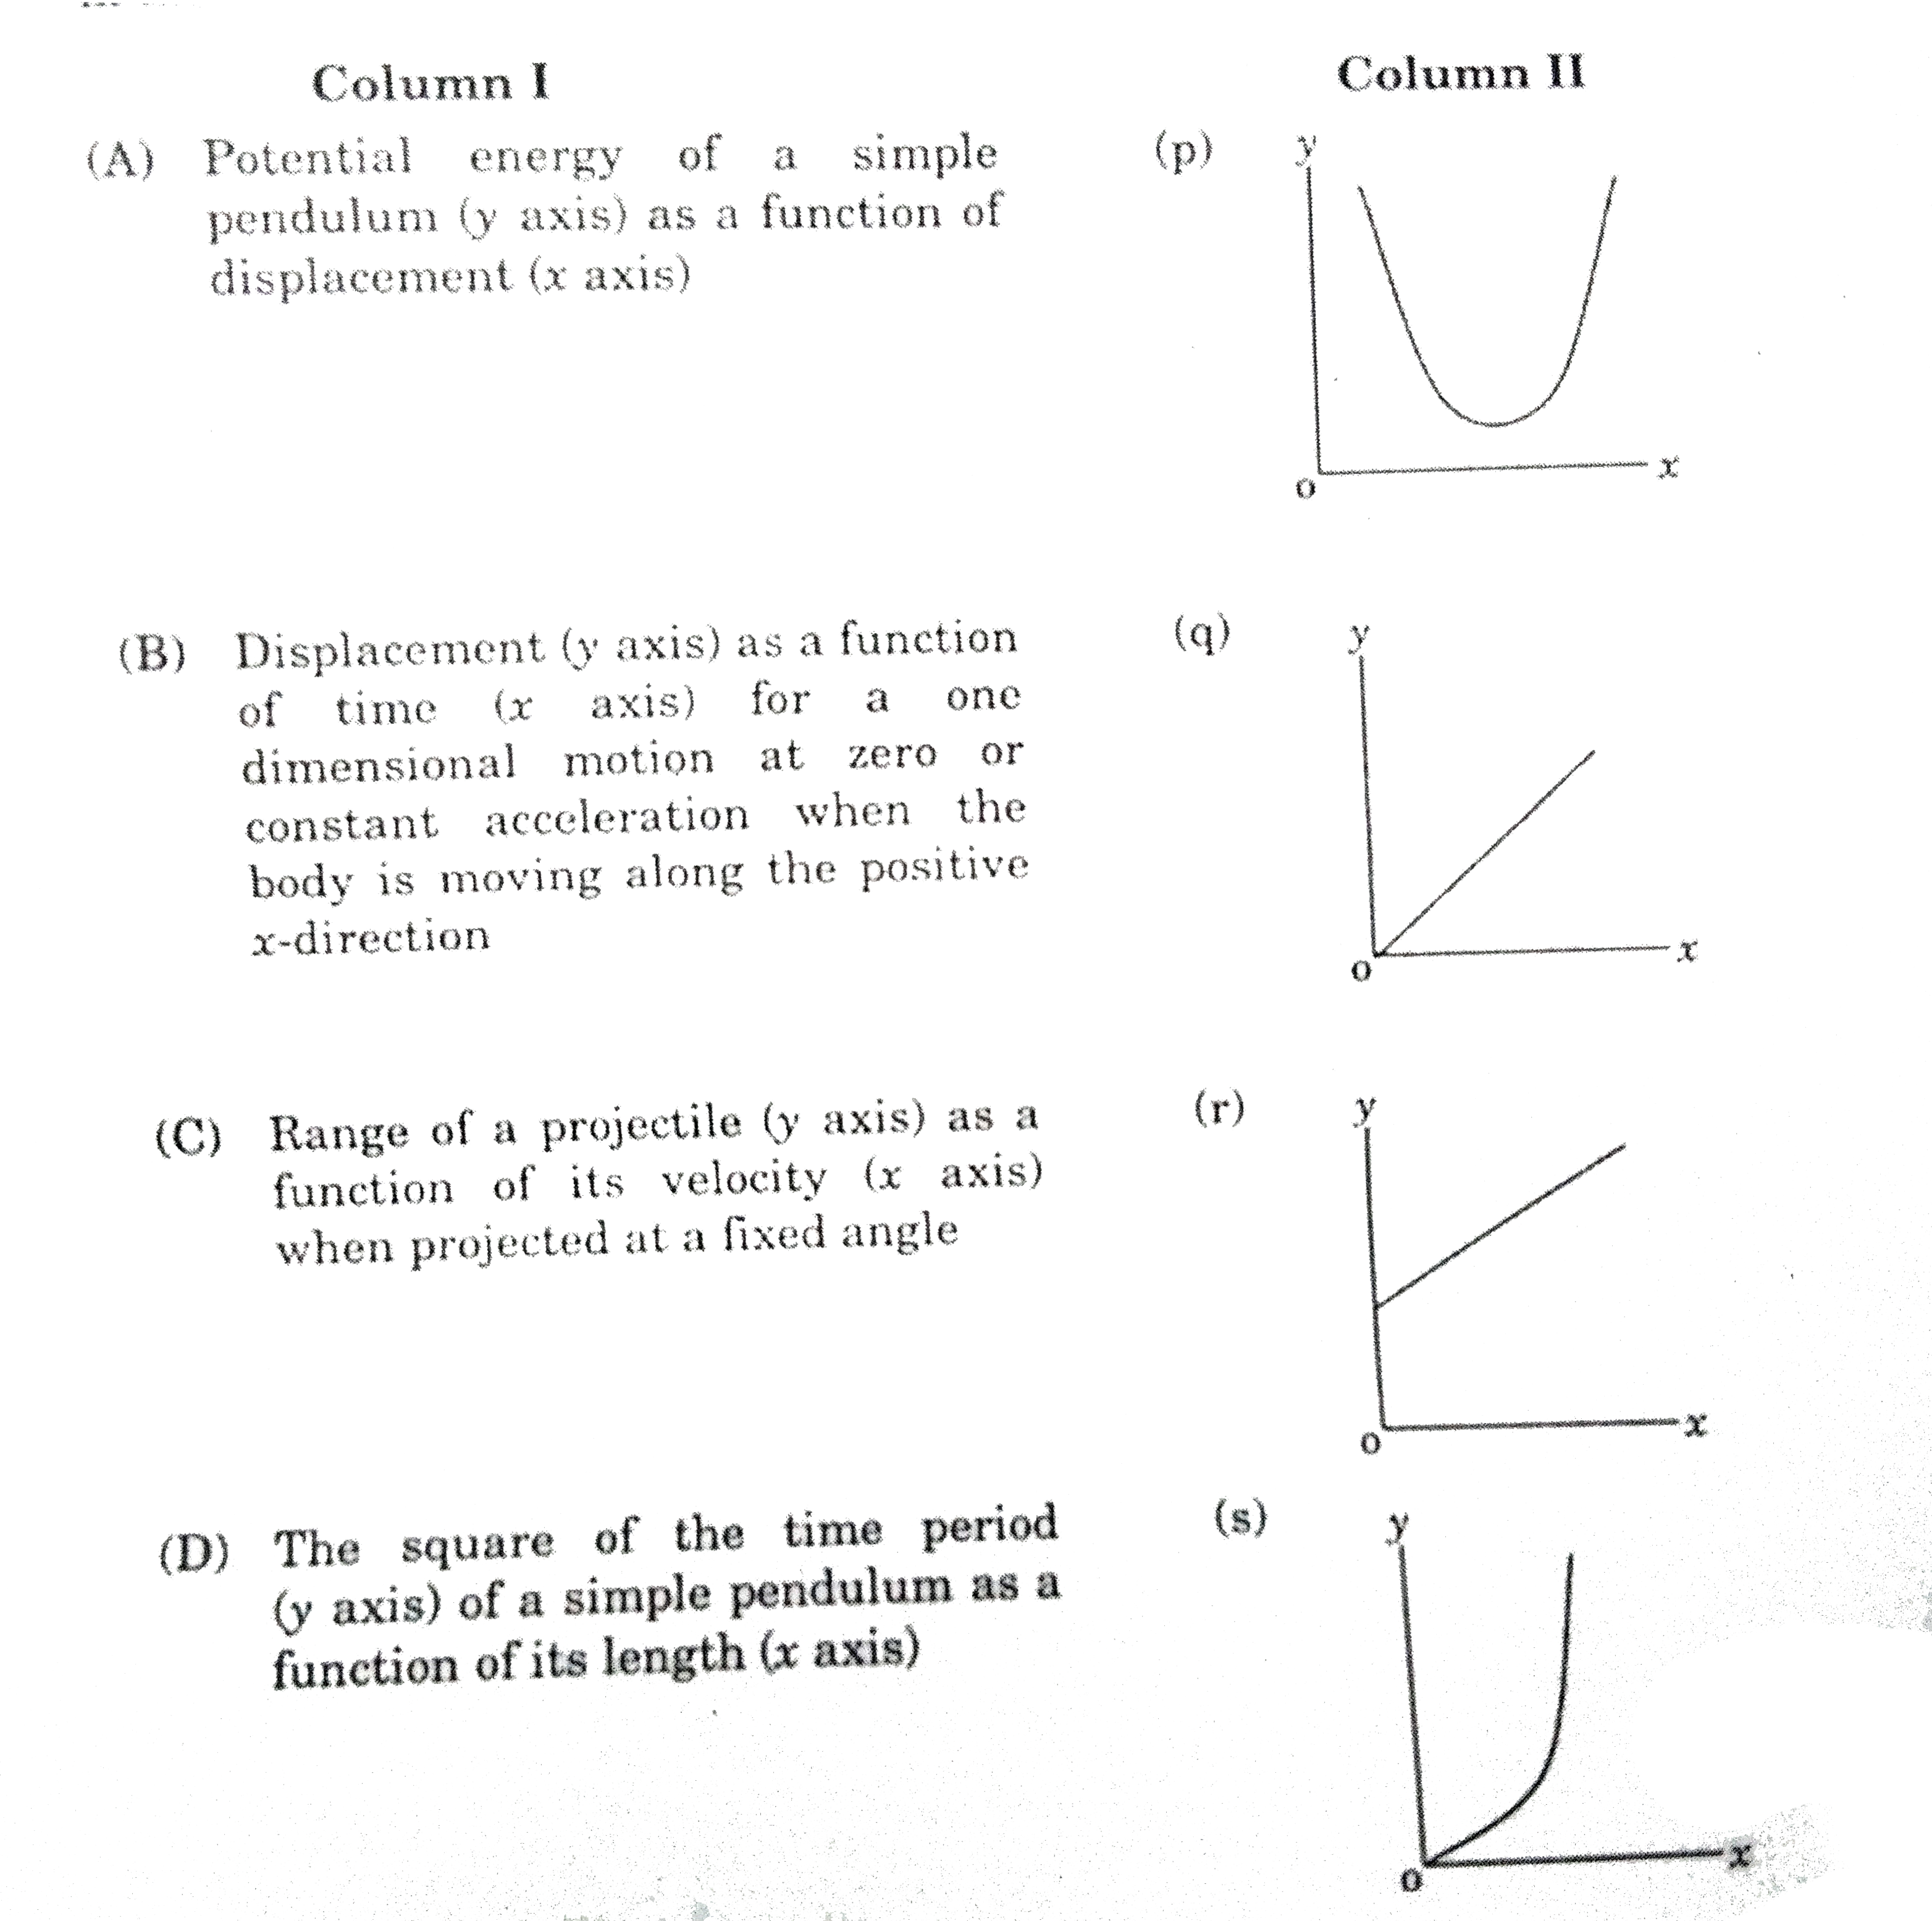
View SolutionColumn I gives a listof possible set of parameters measured in some experiments. The variations of the parameters in the form of graphs are shown in Column II. Match the set of parameters given in Column I with the graphs even in Column II. Indicate your answer by darkening the appropriate bubbles of the 4×4 matrix given in the ORS.
View SolutionThere may be variation in the length of filaments within a flower as in
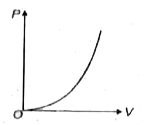
View SolutionThe variation of pressure P with volume V for an ideal diatomic gas is parabolic as shown in the figure . The molar species heat of the gas during this process is
View Solution
