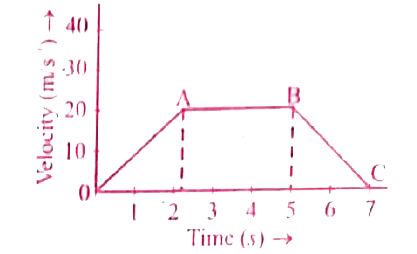
The velocity -time graph for a vehicle is shown in the figure . Draw acceleration-time graph from it
 Solution in Tamil
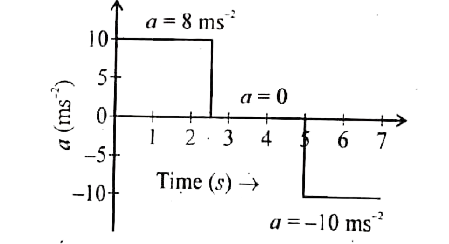
In time 0 to 2.5 s , acceleration of the vehicle,
a = slope of OA =20−02.5−0=8ms−2
In time 2.5 to 5s, velocity of the vehicle is uniform .
So acceleration = 0
In time 5 to 7s , acceleration of the vehicle,
a = slope of BC =0−207−5
=−10ms−2
Hence the acceleration-time graph will be as shown in the figure .
Similar Questions
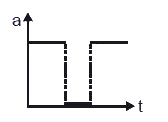
किसी वस्तु के लिये त्वरण-समय ग्राफ चित्र में दिखाया गया है। तो संगत वेग-समय ग्राफ होगा :
View SolutionDraw the velocity-time graph for uniformly accelerated motion. Show that slope of the velocity-time graph gives acceleration of the object.
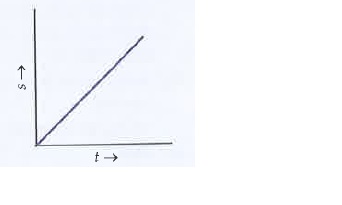
View SolutionDisplacement-time graph of any object is shown in the adjacent figure. Draw velocity-time graph for this motion.
View SolutionAcceleration-time graph of a moving object is shown in figure. Draw the velocity- time graph and displacement-time graph corresponding to this type of motion. .
View SolutionAcceleration -time graph of a body starts from rest as shown below :
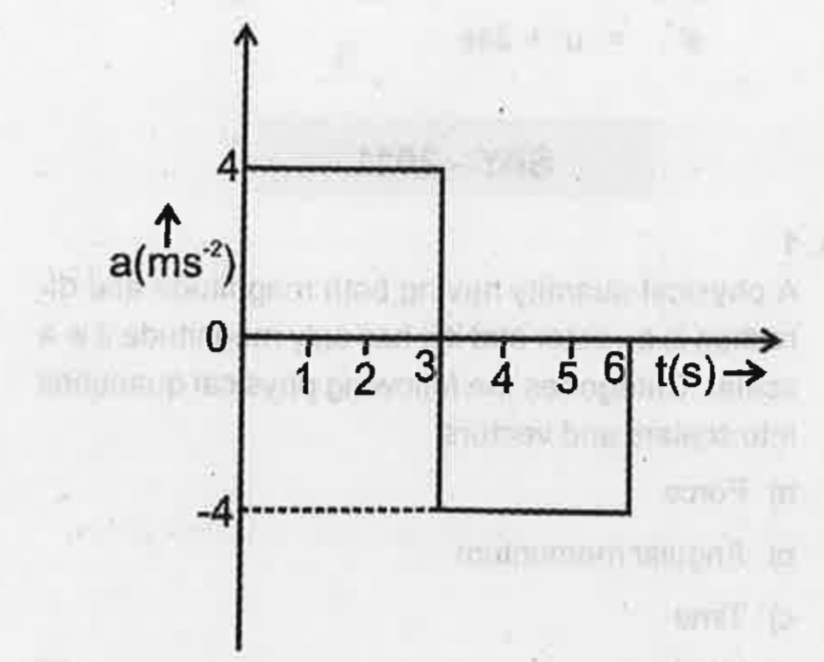
Draw the velocity-time graph using the above graph
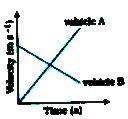
View SolutionVelocity-time graphs vehicle A for vehicles A and B are shown in figure Which vehicle has accelerated motion vehicle B and which vehicle has retarded motion ?
View SolutionThe graph in figure shows the velocity v versus time t for a body. Which of the graphs shown in figure represents the correesponding acceleration versus time graphs ?
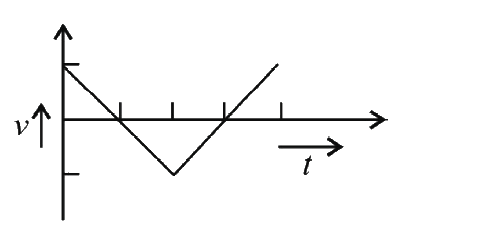
View SolutionVelocity-time graphs vehicle A for vehicles A and B are shown in figure Which vehicle has accelerated motion vehicle B and which vehicle has retarded motion ?
View Solution

