The velocity - time graph of an ascending passenger order lift is given in figure. What is the acceleration of the lift:
(i) during the first two seconds ,
(ii) between 2nd and 10th second,
(iii) during the last two seconds. .
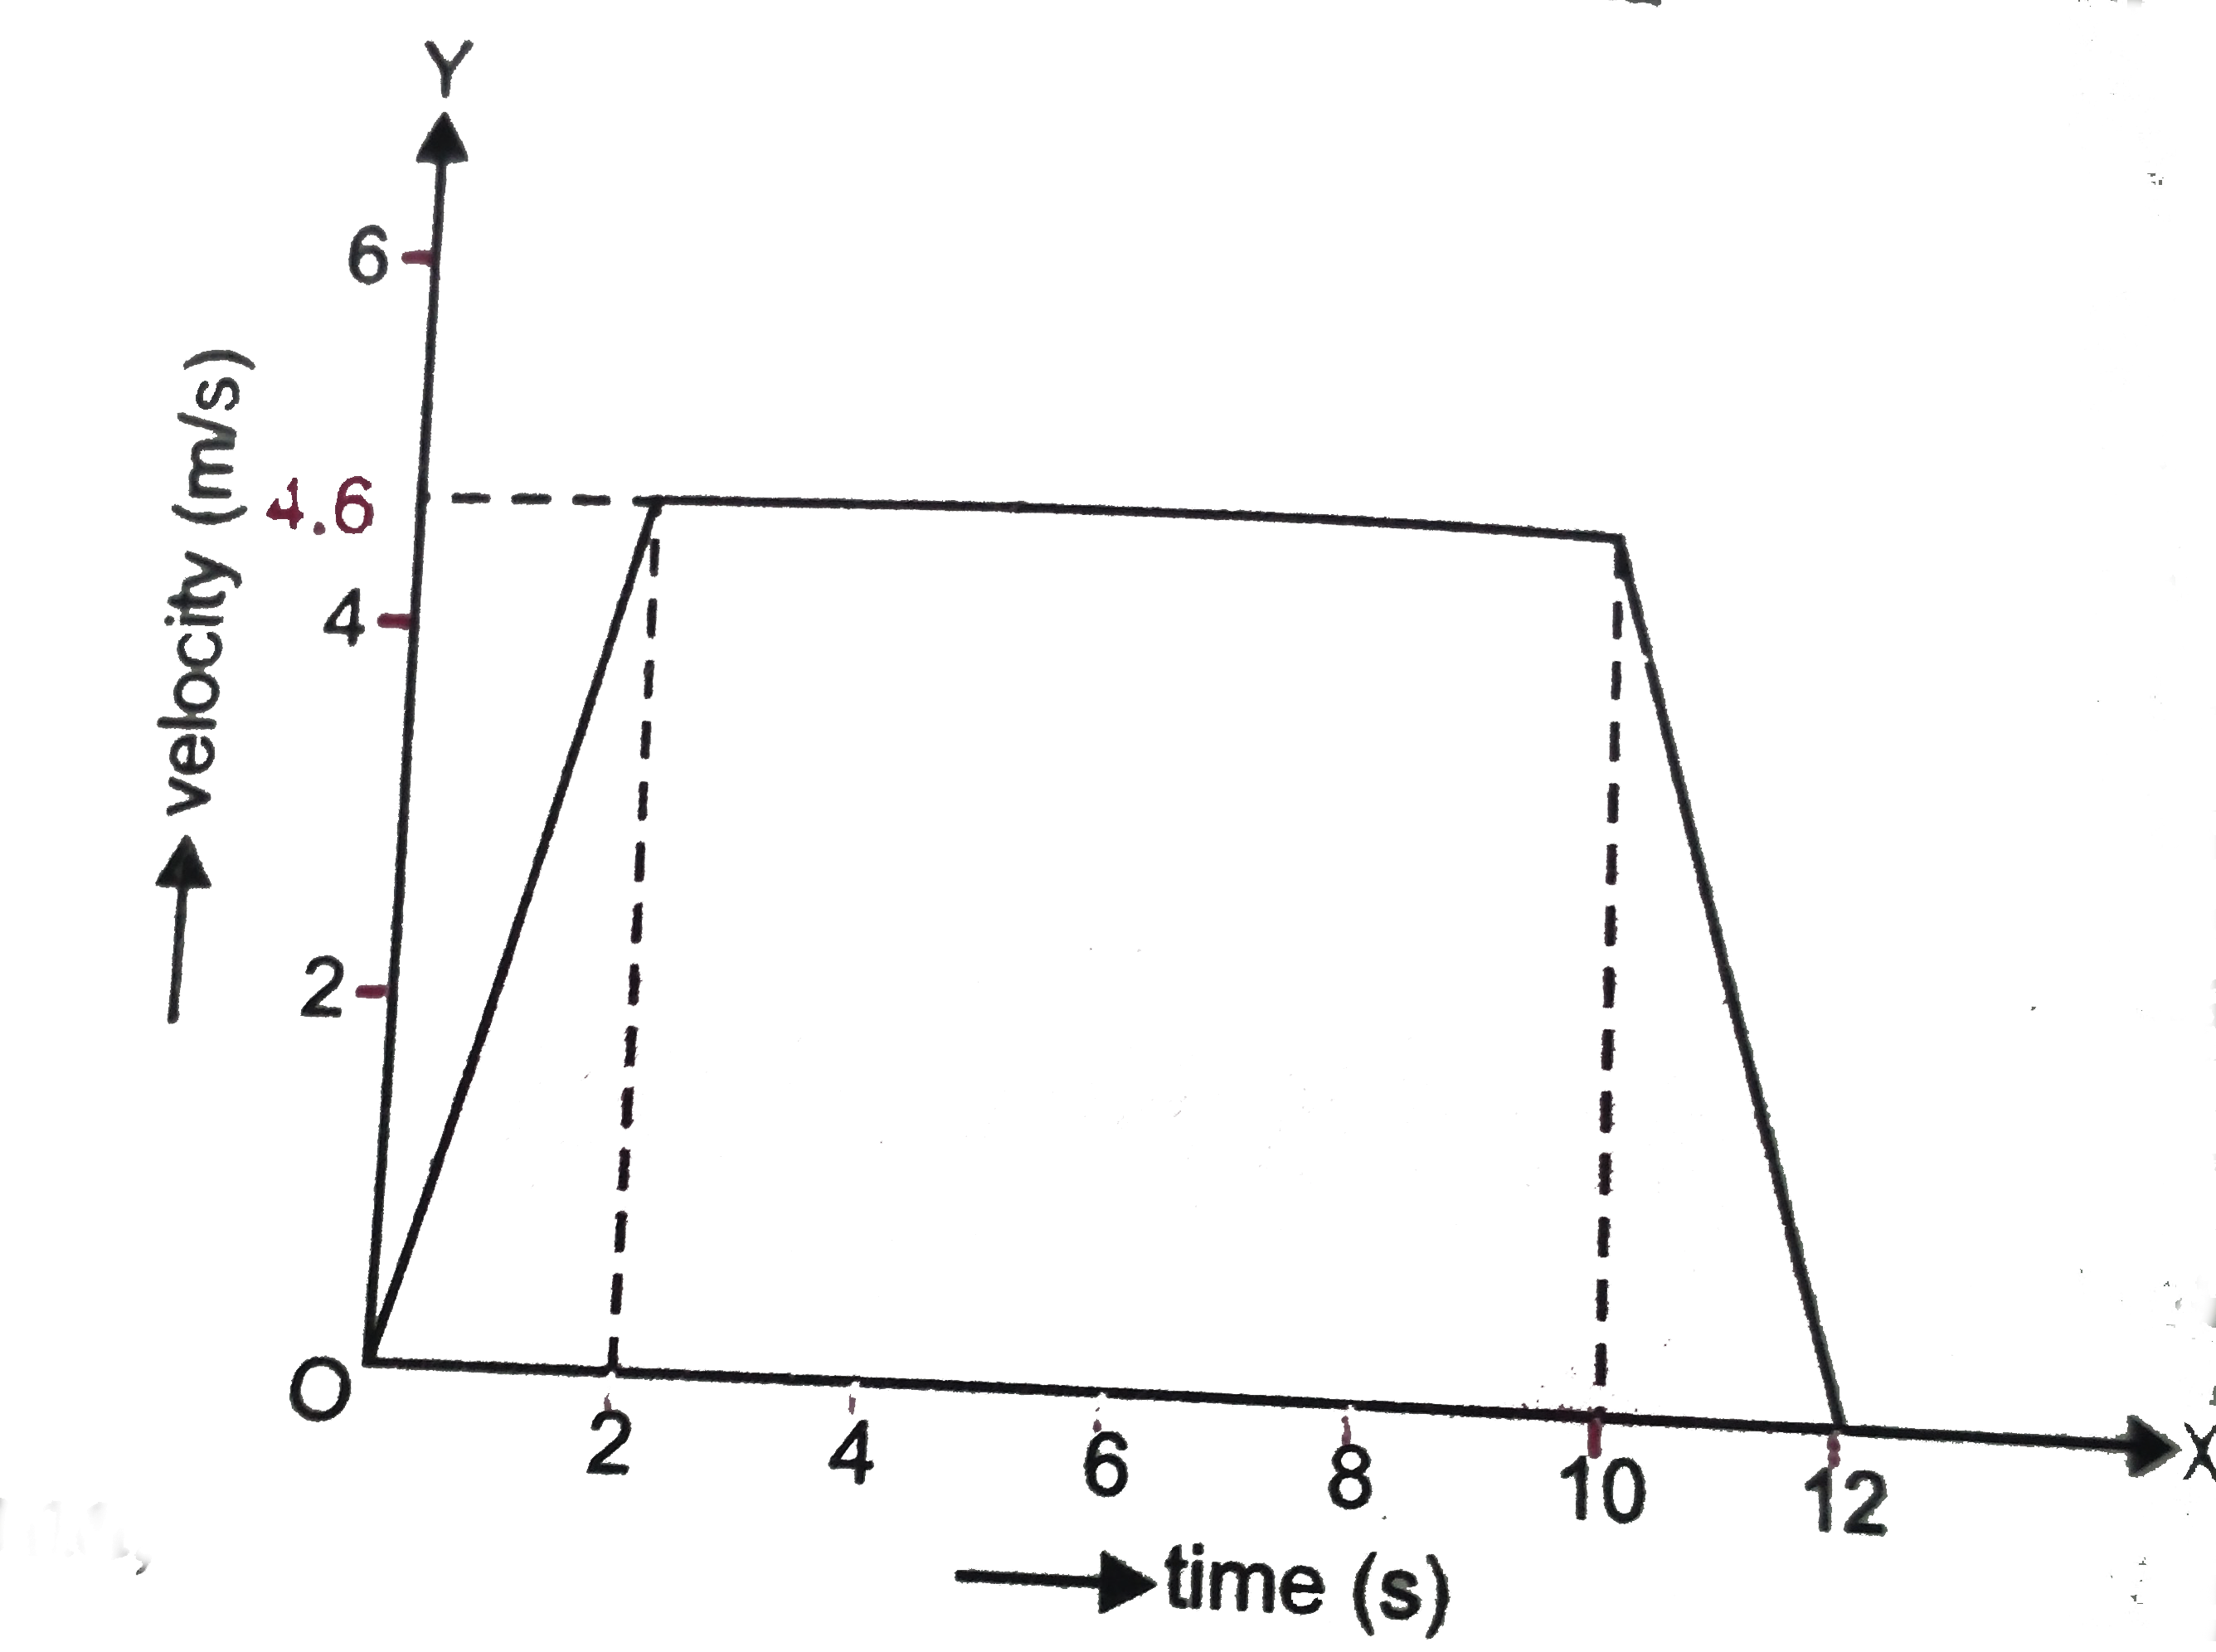
(i) 2.3 m/s2 (ii) Zero (iii) -2.3 m/s2
Similar Questions
The velocity - time graph of an ascending passenger order lift is given in figure. What is the acceleration of the lift:
(i) during the first two seconds ,
(ii) between 2nd and 10th second,
(iii) during the last two seconds. .

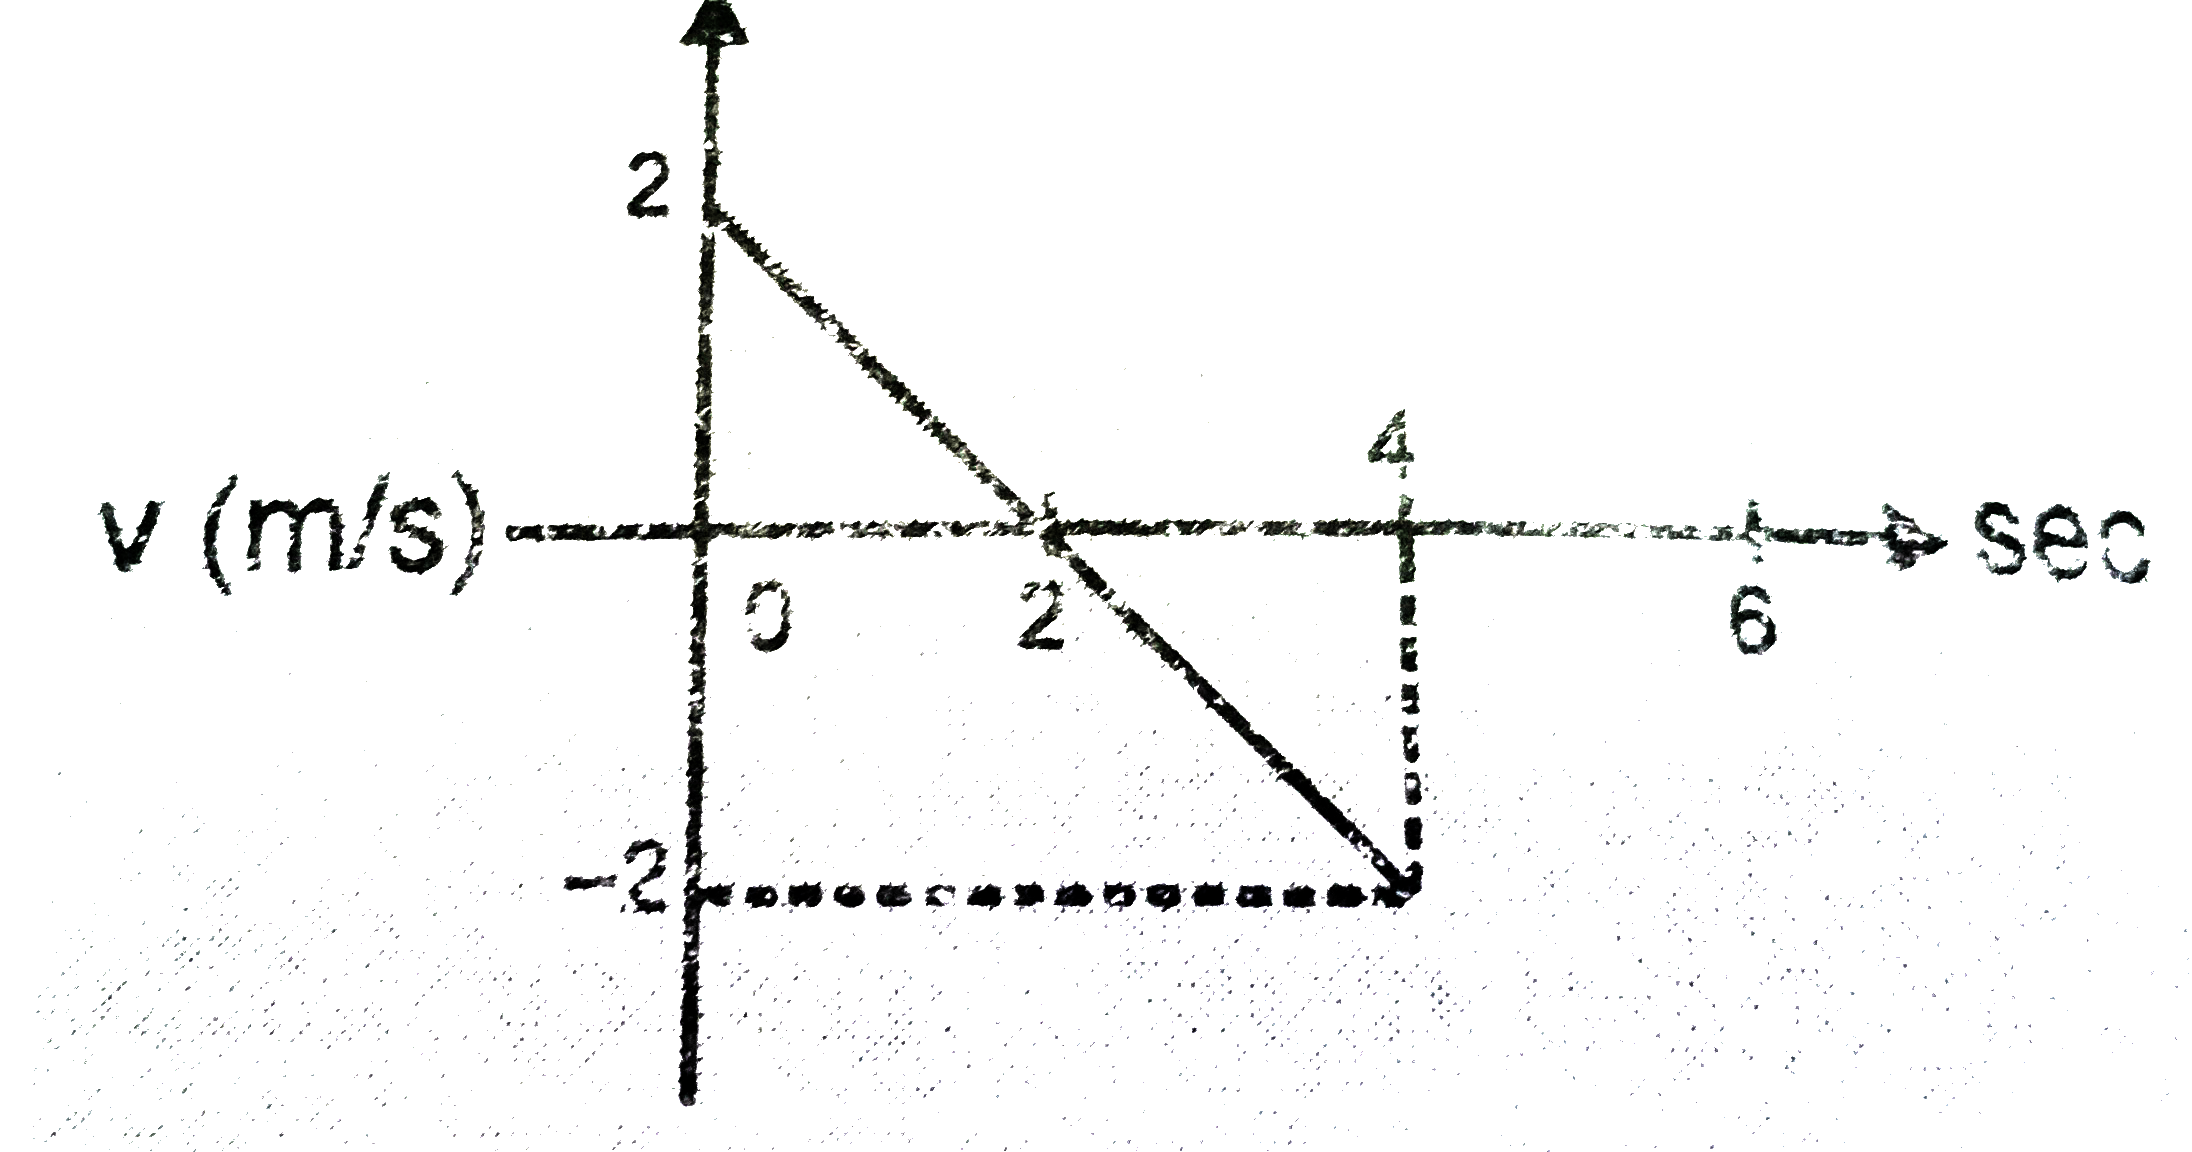
View SolutionVelocity time graph for a particle moving in a line is given.
Calculate the displacement of the particle and distance travelled in first 4 seconds.
View Solution
Knowledge Check
The velocity - time graph of a particle of mass 10 kg is shown in the figure. The net work done on the particle in the first two seconds of the motion is
 A−9300JB12000JC−4500JD−12000J
The velocity-time graph of a car moving along a straight road is shown in figure. The average velocity of the car in first 25 seconds is
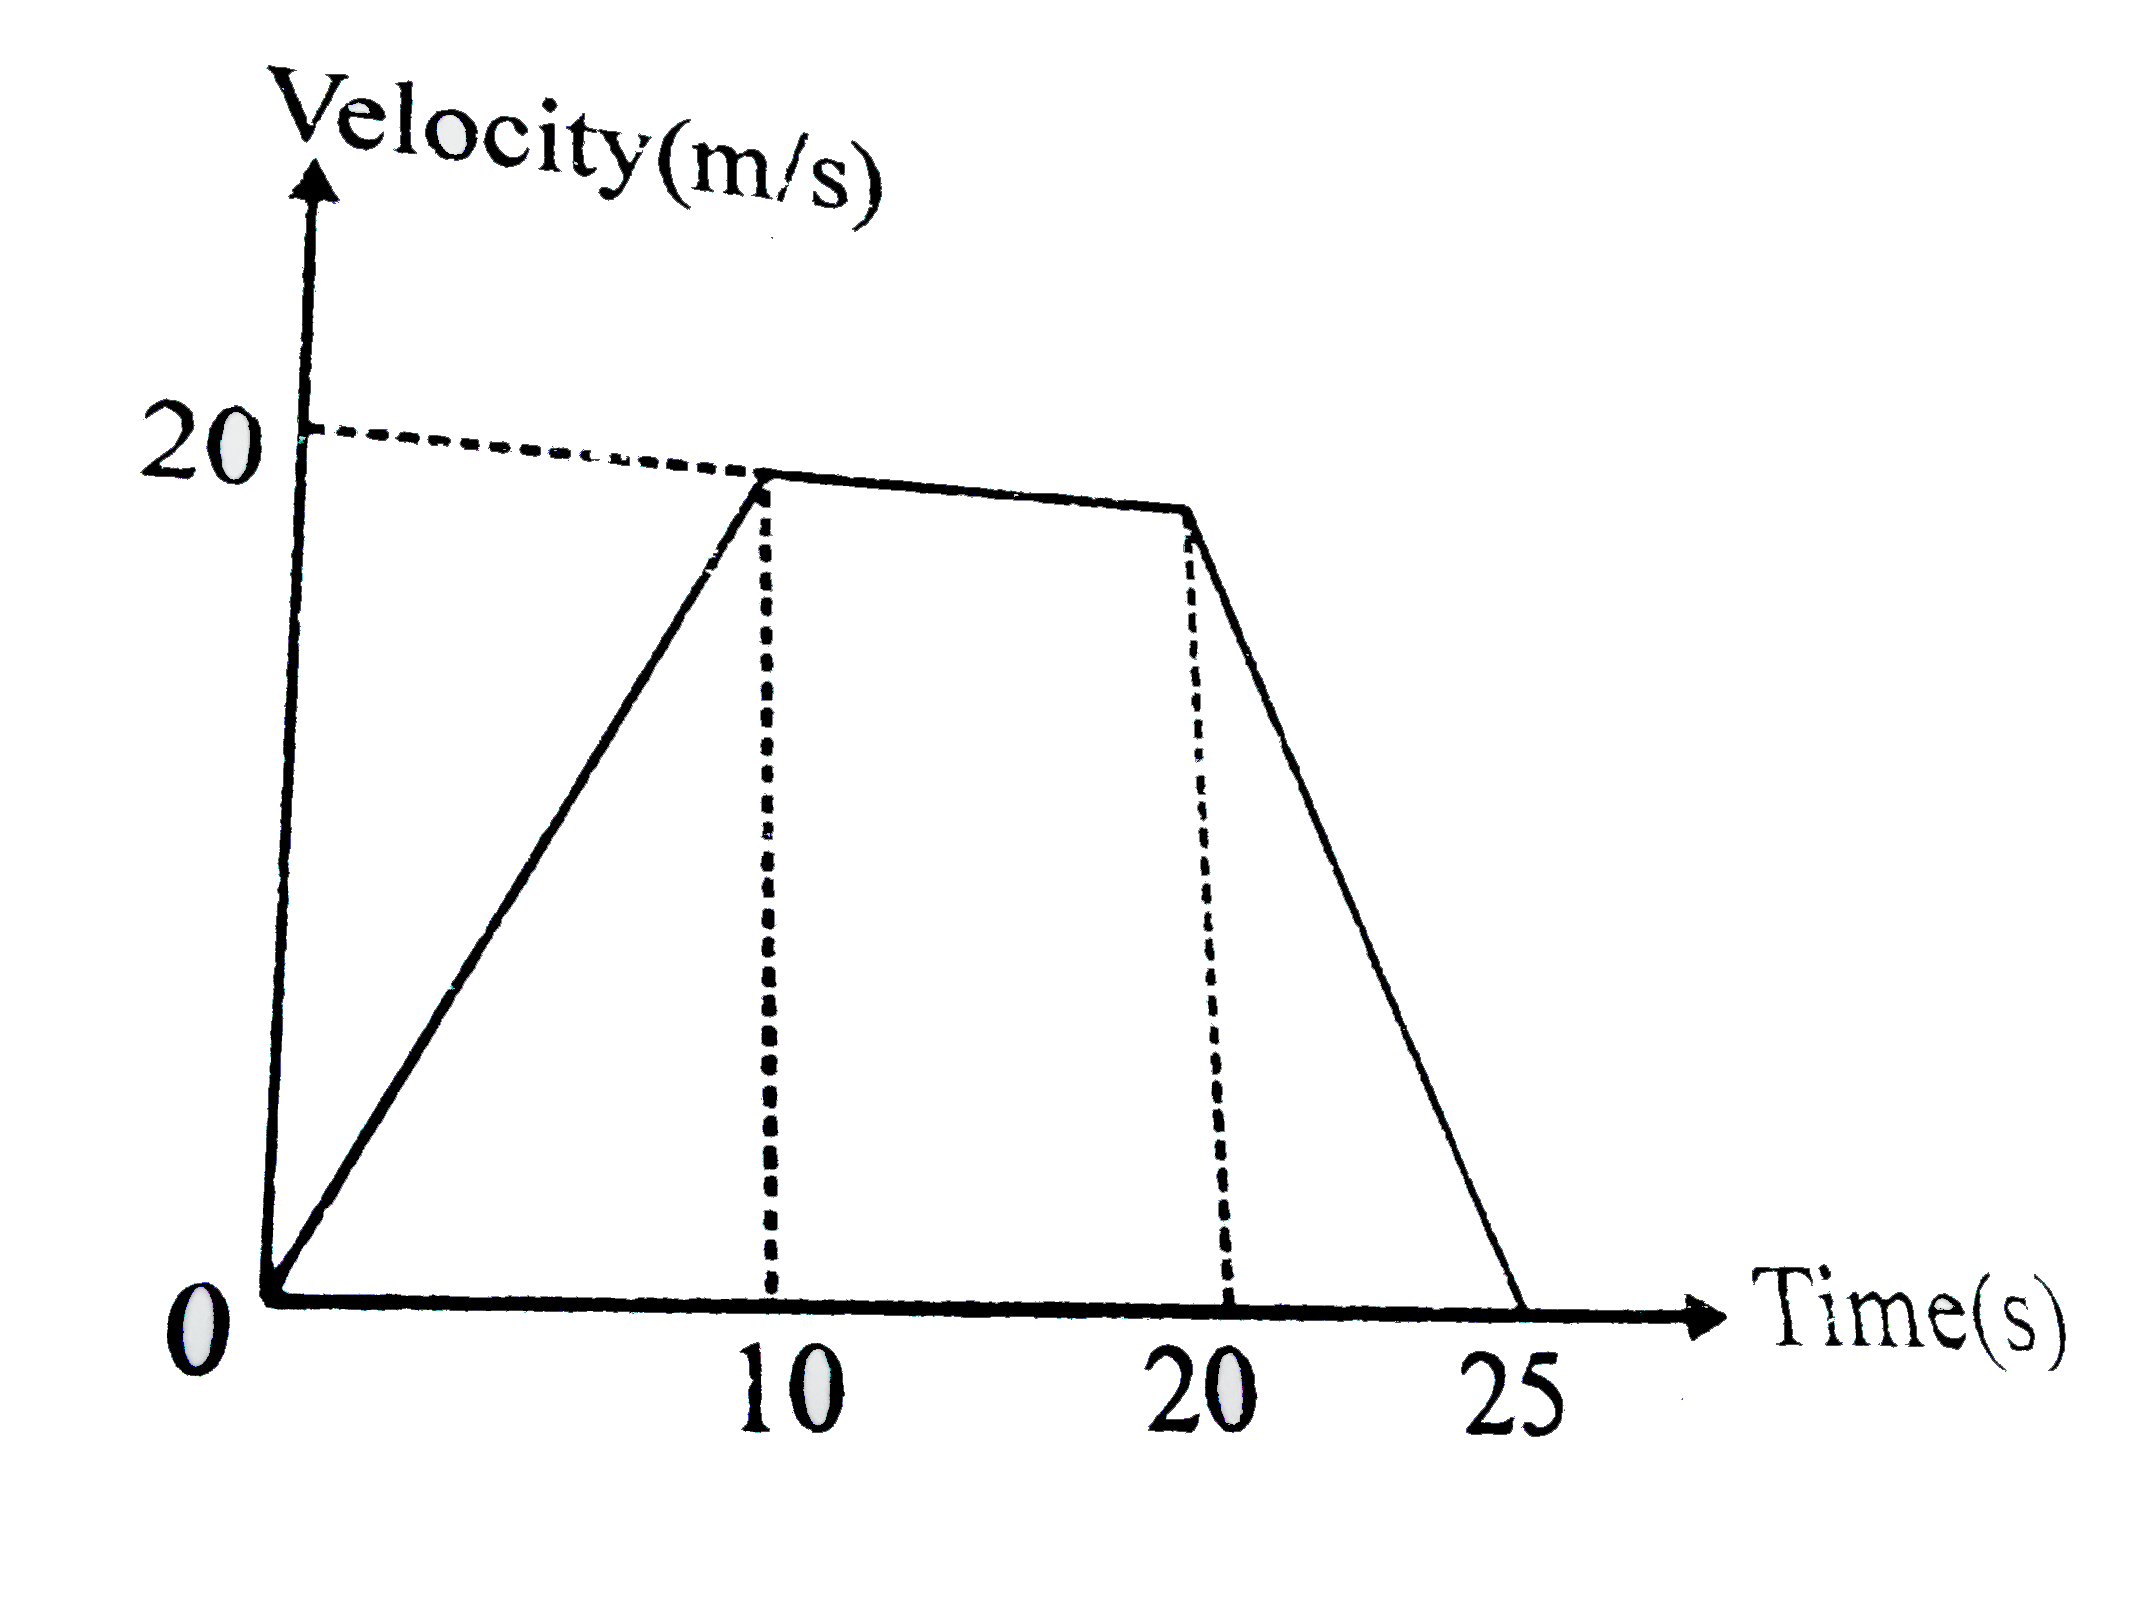 A20m/sB14m/sC10m/sD17.5m/s
The velocity-time graph of a car moving along a straight road is shown in figure. The average velocity of the car is first 25 seconds is
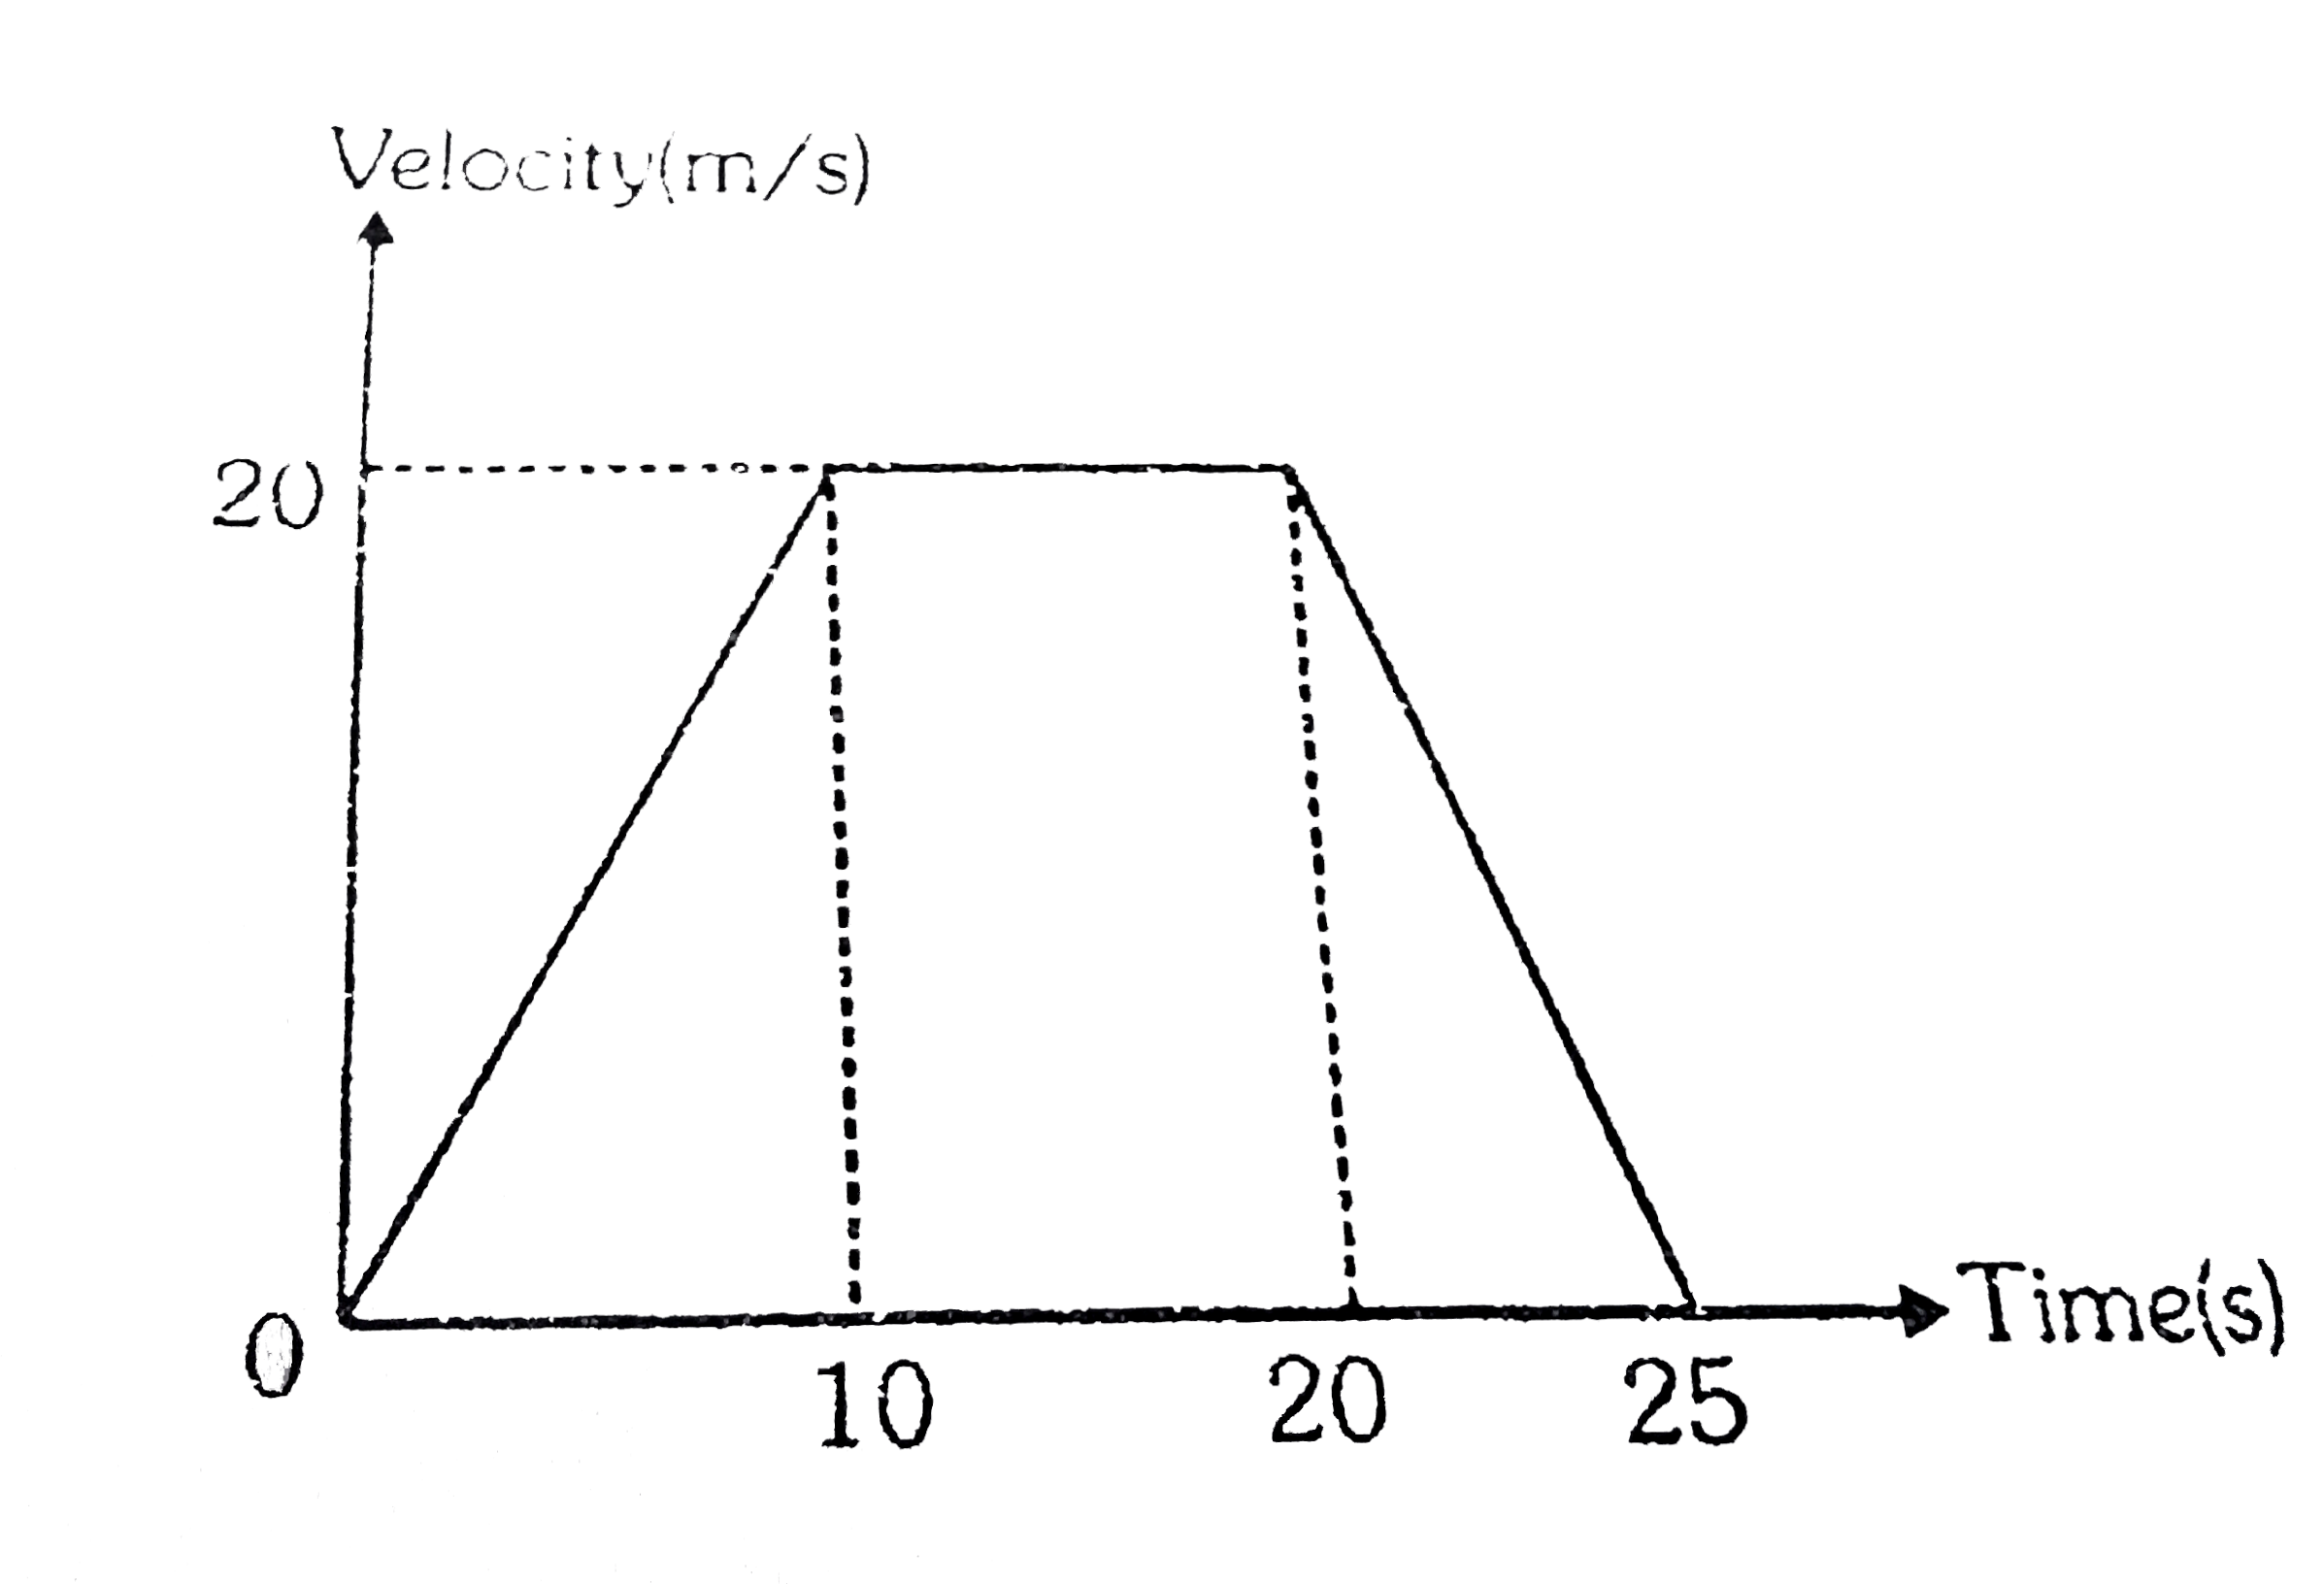 A20m/sB14m/sC10m/sD17.5m/s
The velocity-time graph of a particle moving along a straight line is shown in the figure-given below
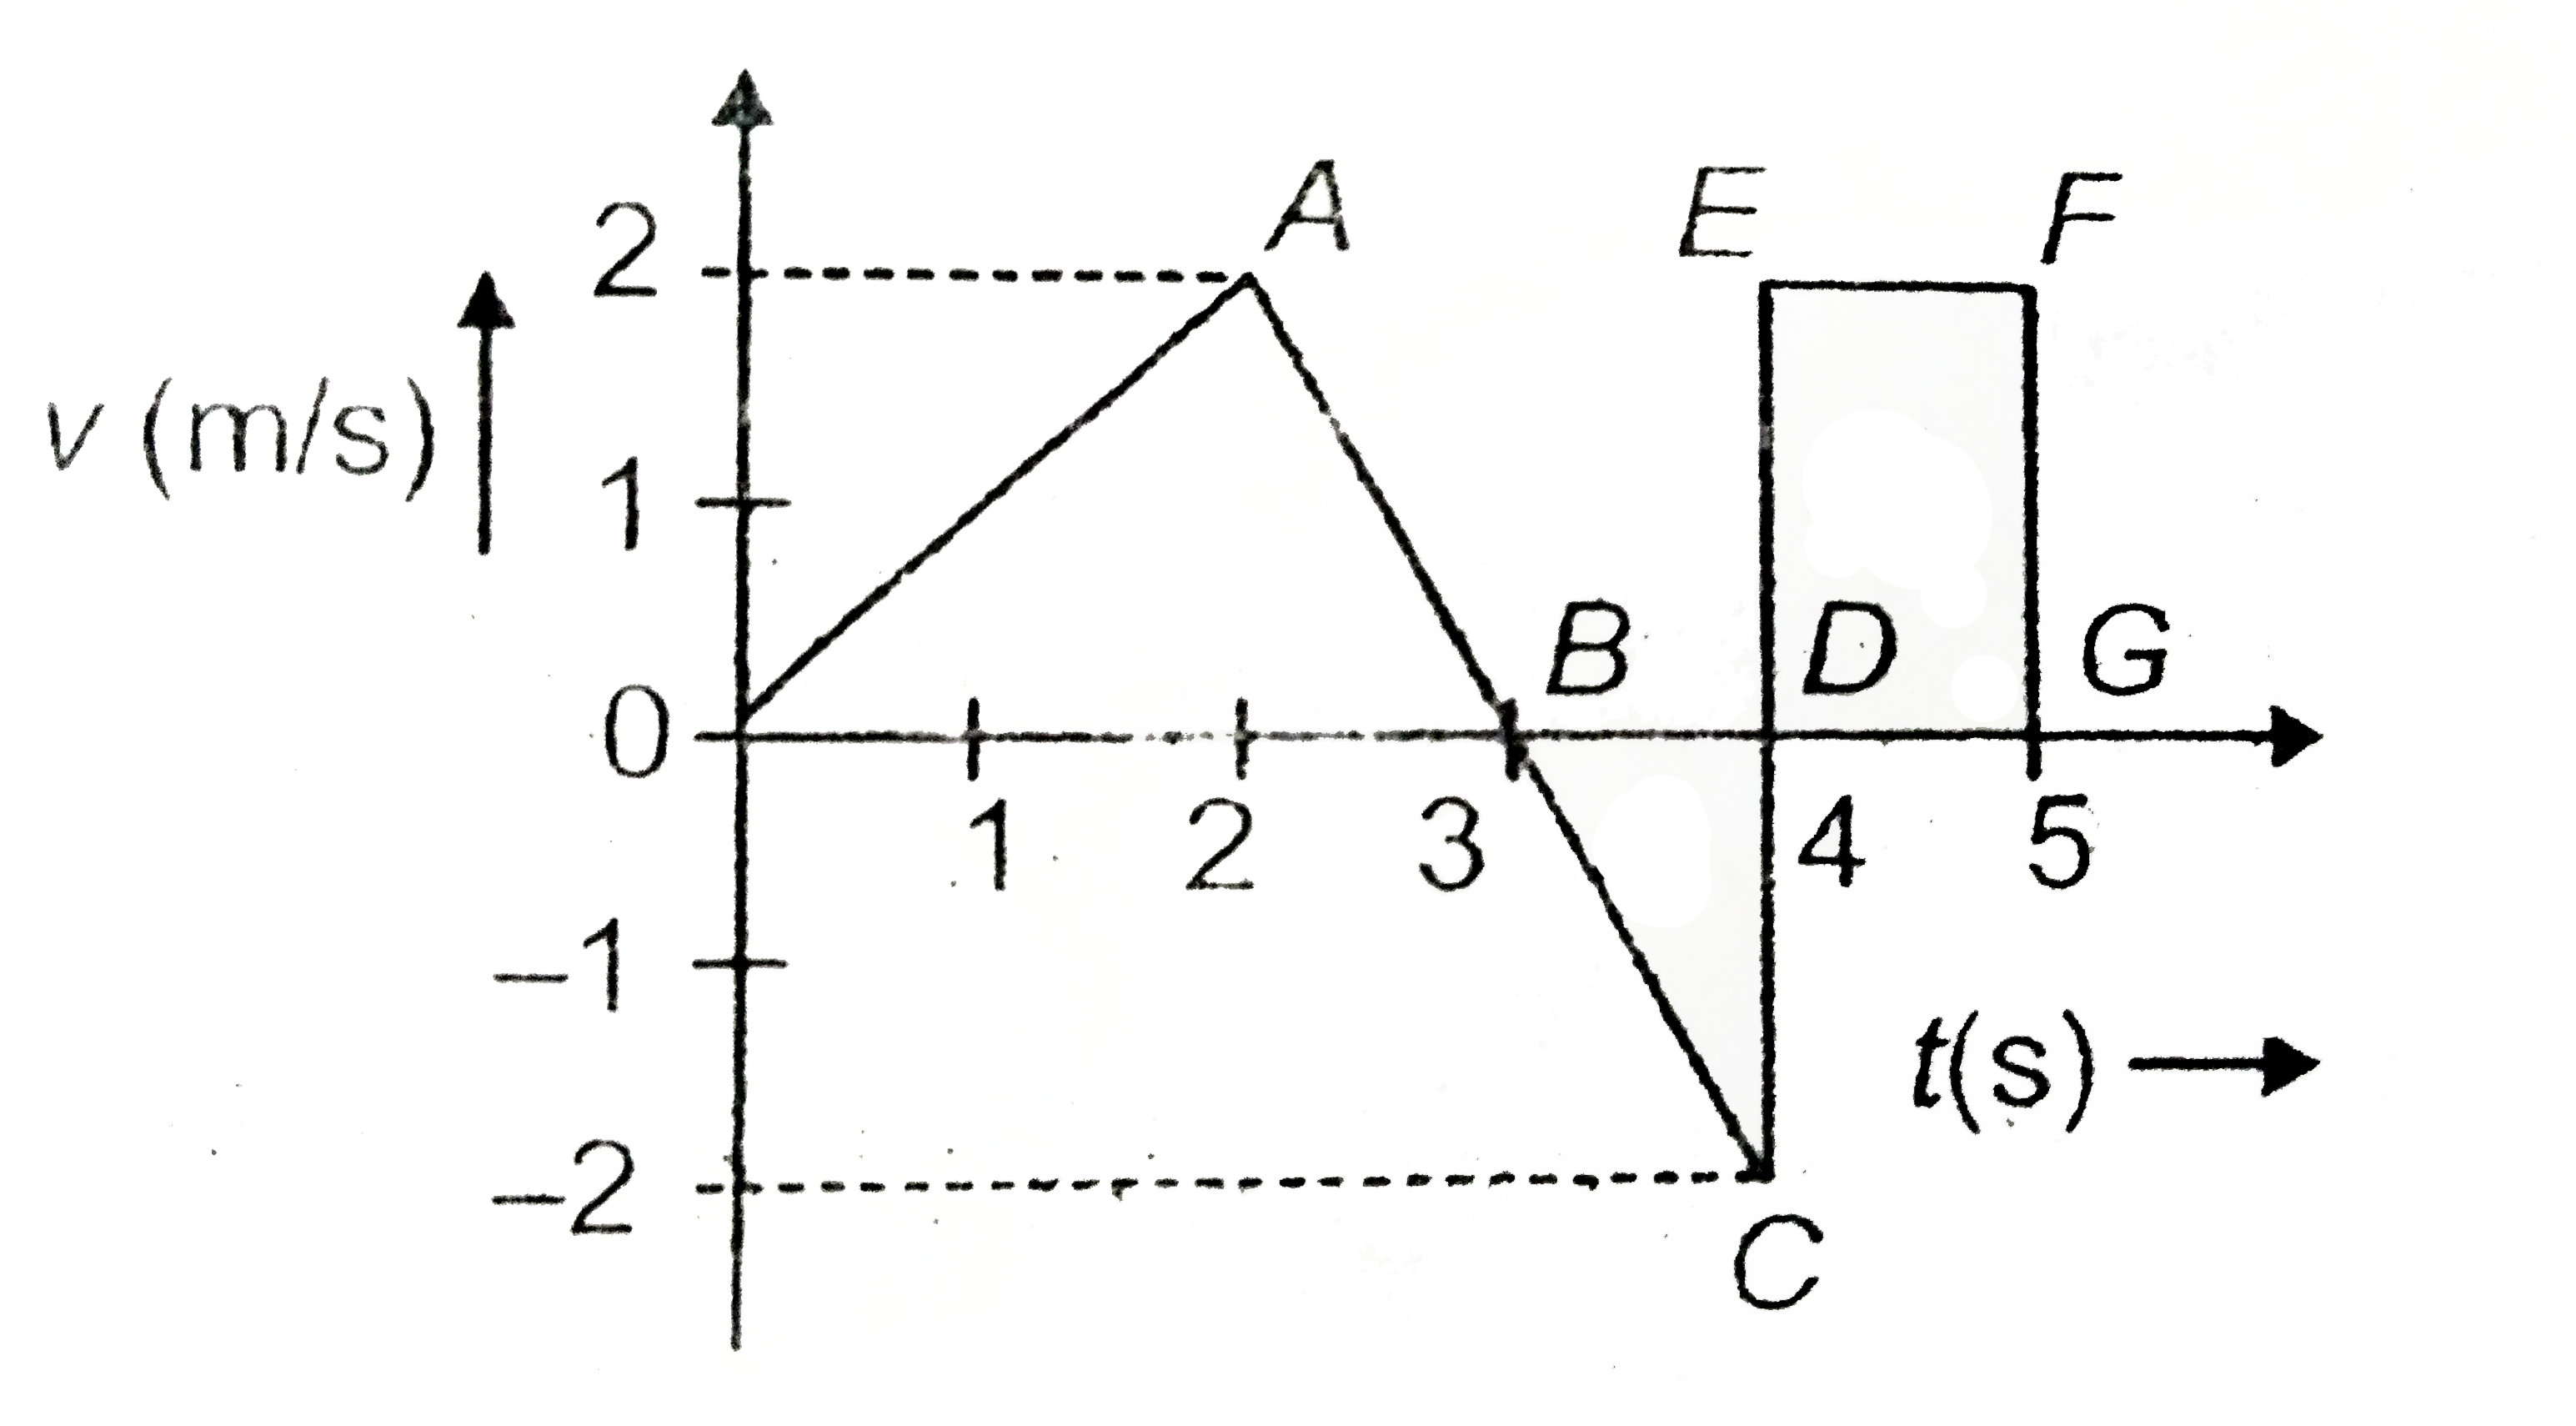
The displacement of the particle in 5 second is
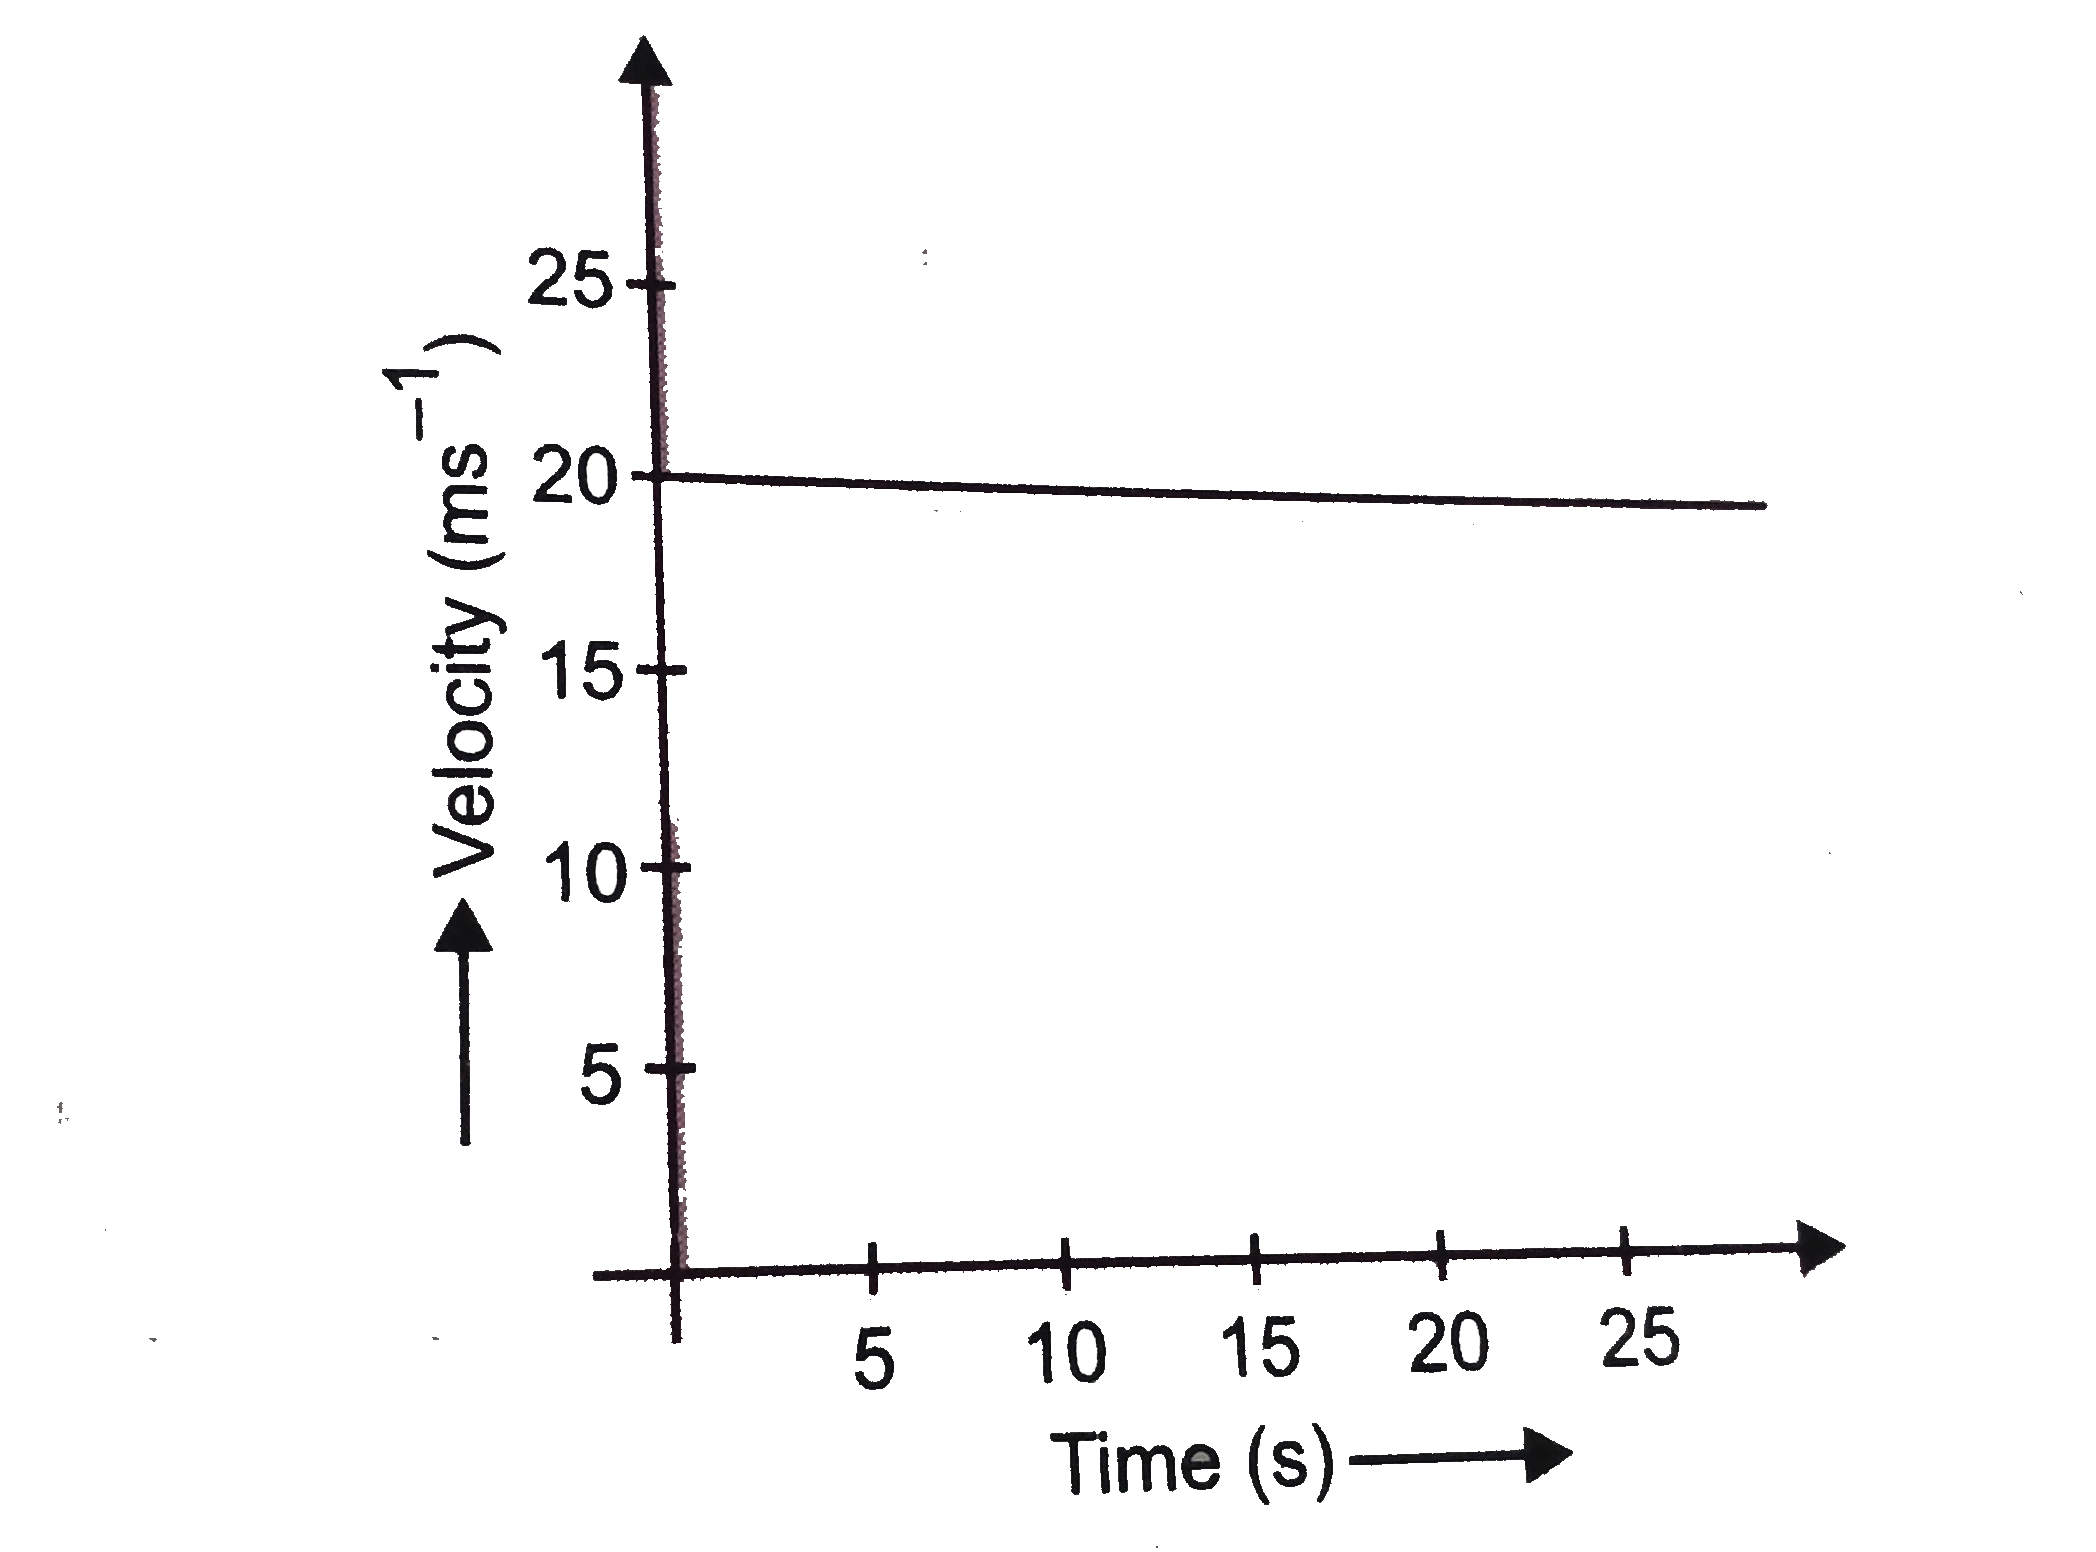
View SolutionThe velocity-time graph shows the motion of a cyclist. Find (i) its acceleration (ii) its velocity and (iii) the distance covered by the cyclist in 15 seconds.
View SolutionThe velocity - time graph of a particle moving along a straight line is shown in the figure given below
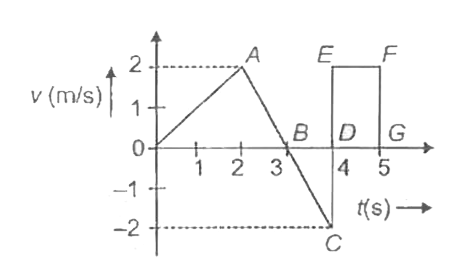
The displacement of the particle in 5 second is
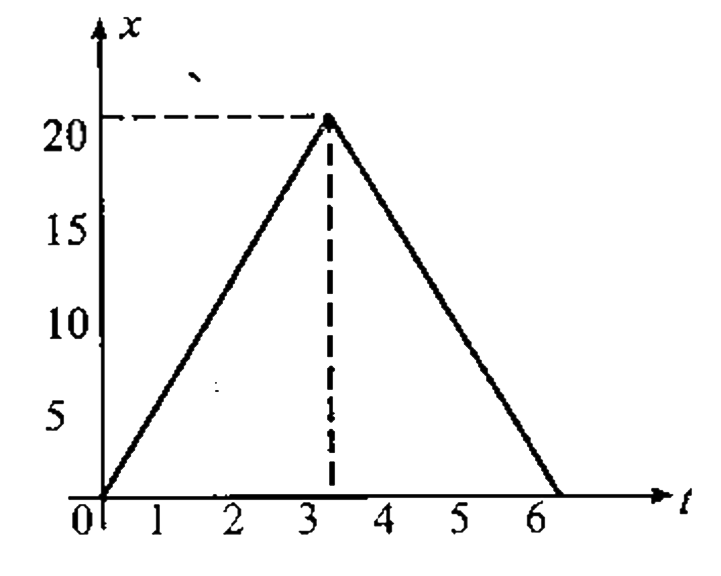
View SolutionFor the displacement-time graph shown in figure, the ratio of the magnitudes of the speeds during the first two second and the next four second is
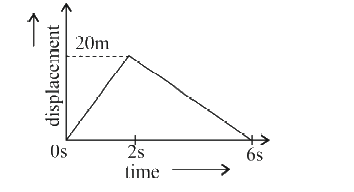
View SolutionFor the displacement time graph shown in figure -1.100, the ratio of the speeds during the first two seconds and the next four second is :
View Solution
