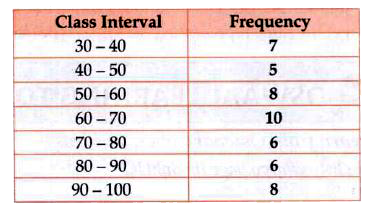
Change the following data into 'less than type' distribution and draw its ogive:

Step by step video solution for Change the following data into 'less than type' distribution and draw its ogive: by Maths experts to help you in doubts & scoring excellent marks in Class 10 exams.
Updated on:21/07/2023Topper's Solved these Questions
- STATISTICSBOOK - OSWAL PUBLICATIONCHAPTER - STATISTICSEXERCISE - Multiple Choice Questions
60 Videos
- STATISTICSBOOK - OSWAL PUBLICATIONCHAPTER - STATISTICSEXERCISE - Very Short Answer Type Questions
4 Videos
- STATISTICSBOOK - OSWAL PUBLICATIONCHAPTER - STATISTICSEXERCISE - BOARD CORNER (Short answer type questions)
5 Videos
- SOME APPLICATIONS OF TRIGONOMETRY (HEIGHTS AND DISTANCES) BOOK - OSWAL PUBLICATIONCHAPTER - SOME APPLICATIONS OF TRIGONOMETRY (HEIGHTS AND DISTANCES) EXERCISE - CASE-BASED MCQs
15 Videos
- SURFACE AREAS AND VOLUMES BOOK - OSWAL PUBLICATIONCHAPTER - SURFACE AREAS AND VOLUMES EXERCISE - BOARD CORNER (LONG ANSWER TYPE QUESTIONS)
9 Videos
Similar Questions
The following table gives the height of 42 trees in meters:

Change the above distribution to less than type distribution and draw its ogive. Hence obtain the median value.
View SolutionChange the following distribution to a 'more than type' distribution. Hence, draw the 'more than type' ogive for this distribution.

View SolutionThe following table gives production yield per hectare of wheat of 100 farms of a village.Change the distribution to a more than type distribution, and draw its ogive.
View SolutionThe following distribution gives the daily income of 50 workers of a factory: Convert the distribution above to a less than type cumulative frequency distribution and draw its ogive
View SolutionWrite the following data into less than cummulative frequency distribution table.

View SolutionThe following distribution gives the daily income of 50 workers of a factory.

Convert the distribution above to a less than type cumulative frequency distribution, and draw its ogive.
View SolutionThe following distribution gives the daily income of 60 workers of a factory. Convert the distribution above to a less than type cumulative frequency distribution, and draw its ogive.
View SolutionThe following distribution gives the daily income of 50 workers of a factory:
Daily income200−250250−300300−350350−400400−450450−500Number of workers105118610
Convert the distribution to a less than type cumulative frequency distribution and draw its ogive. Hence obtain the median daily income.
View SolutionThe following distribution gives the daily income of 50 workers of a factory: Daily income (in Rs): 100-120 120-140 140-160 160-180 180-200 Number of workers: 12 14 8 6 10 Convert the above distribution to a less than type cumulative frequency distribution and draw its ogive.
View SolutionThe following distribution gives the daily income of 50 workers of a factory.
Daily income400−420420−440440−460460−480480−500Number of workers12148610
Convert this distribution to less than type of cumulative frequency distribution and draw its ogive.
View Solution
