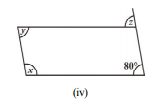
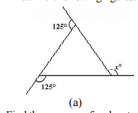
Consider the following parallelograms. Find the values of the unknowns x, y, z.
 Solution in Punjabi
The correct Answer is:y=130∘,z=130∘
Step by step video & text solution for Consider the following parallelograms. Find the values of the unknowns x, y, z. by Maths experts to help you in doubts & scoring excellent marks in Class 8 exams.
Updated on:21/07/2023Topper's Solved these Questions
- UNDERSTANDING QUADRILATERALSBook:SWAN PUBLICATIONChapter:UNDERSTANDING QUADRILATERALSExercise:EXERCISE 3.4
Explore 19 Videos
- UNDERSTANDING QUADRILATERALSBook:SWAN PUBLICATIONChapter:UNDERSTANDING QUADRILATERALSExercise:TRY THESE
Explore 12 Videos
- UNDERSTANDING QUADRILATERALSBook:SWAN PUBLICATIONChapter:UNDERSTANDING QUADRILATERALSExercise:EXERCISE 3.2
Explore 10 Videos
- SQUARES AND SQUARE ROOTSBook:SWAN PUBLICATIONChapter:SQUARES AND SQUARE ROOTSExercise:Exercise 6.4
Explore 37 Videos
- VISUALISING SOLID SHAPES Book:SWAN PUBLICATIONChapter:VISUALISING SOLID SHAPES Exercise:Exercise 10.3
Explore 11 Videos
Similar Questions
State whether True or False. All rectangles are squares
View SolutionTry to give few more examples and non -example for a polygon .
View SolutionFind x in the following figures.

View SolutionFind the square root of each of the following numbers by Division method: 2304
View SolutionCan a polyhedron have for its faces: 3 triangles?
View SolutionWhich of the following are correct chain isomers of butane ? (i)
View SolutionDetermine the point of symmetry of a regular hexagon.
View SolutionDtermine the images of the following figure about the given line :
View SolutionMatch the following Column A to Column B

View SolutionMatch the following Column A to Column B

View SolutionMatch the following Column A to Column B

View SolutionFind the perimeter of the figure given below.

View SolutionFind the area of the figure given below.

View SolutionThe inequation represented by the graph given below is :
View SolutionThe inequation that best describes the graph given below is _________
View SolutionThe inequation that best describes the following graph is _________
View Solution