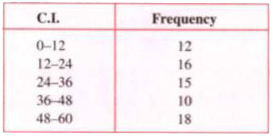
Contruct a cumulative frequency distributions table from the following frequency table:

Step by step video solution for Contruct a cumulative frequency distributions table from the following frequency table: by Maths experts to help you in doubts & scoring excellent marks in Class 9 exams.
Updated on:21/07/2023Topper's Solved these Questions
- CHAPTER REVISION (STAGE 2) Book:ICSEChapter:CHAPTER REVISION (STAGE 2) Exercise:MEAN AND MEDIAN
Explore 4 Videos
- CHAPTER REVISION (STAGE 2) Book:ICSEChapter:CHAPTER REVISION (STAGE 2) Exercise:AREA AND PERIMETER OF PLANE FIGURES
Explore 8 Videos
- CHAPTER REVISION (STAGE 2) Book:ICSEChapter:CHAPTER REVISION (STAGE 2) Exercise:CONSTRUCTIONS OF POLYGONS
Explore 19 Videos
- AREA THEOREMSBook:ICSEChapter:AREA THEOREMSExercise:Exercies 16(C )
Explore 22 Videos
- CHAPTERWISE REVISION (STAGE 1) Book:ICSEChapter:CHAPTERWISE REVISION (STAGE 1) Exercise:Graphical solution
Explore 10 Videos
Similar Questions
Find the mean of the following numbers :
62,58,84,71,68,70,53,63,56 and 65.
View SolutionThe base of a triangular field is 2.4 times its height. If the cost of leveling the field at the rate of rupes 20 per square metre is rupes 9,600 find its base and height.
View SolutionContruct a parallelogram in which diagonals are 6.5 cm and 4 cm long and angle between them is 60∘
View SolutionIn the given figure, the diagonals AC and BD intersects at point O. If OB=OD and AB//DC, prove that :
(i) Area(ΔDOC)=Area(ΔAOB).
(ii) Area(ΔDCB)=Area(ΔACB).
(iii) ABCD is a parallelogram.

View SolutionSolve the following paris of linear (simultaneous) equation using method of elimination by substution:
2x - 3y = 7
5x + y = 9
View SolutionHow many lines of symmetry does the above figure have ?
View SolutionWhich of the following are correct chain isomers of butane ? (i)
View SolutionDetermine the point of symmetry of a regular hexagon.
View SolutionDtermine the images of the following figure about the given line :
View SolutionMatch the following Column A to Column B

View SolutionMatch the following Column A to Column B

View SolutionMatch the following Column A to Column B

View SolutionThe inequation represented by the graph given below is :
View SolutionThe inequation that best describes the graph given below is _________
View SolutionThe inequation that best describes the following graph is _________
View Solution