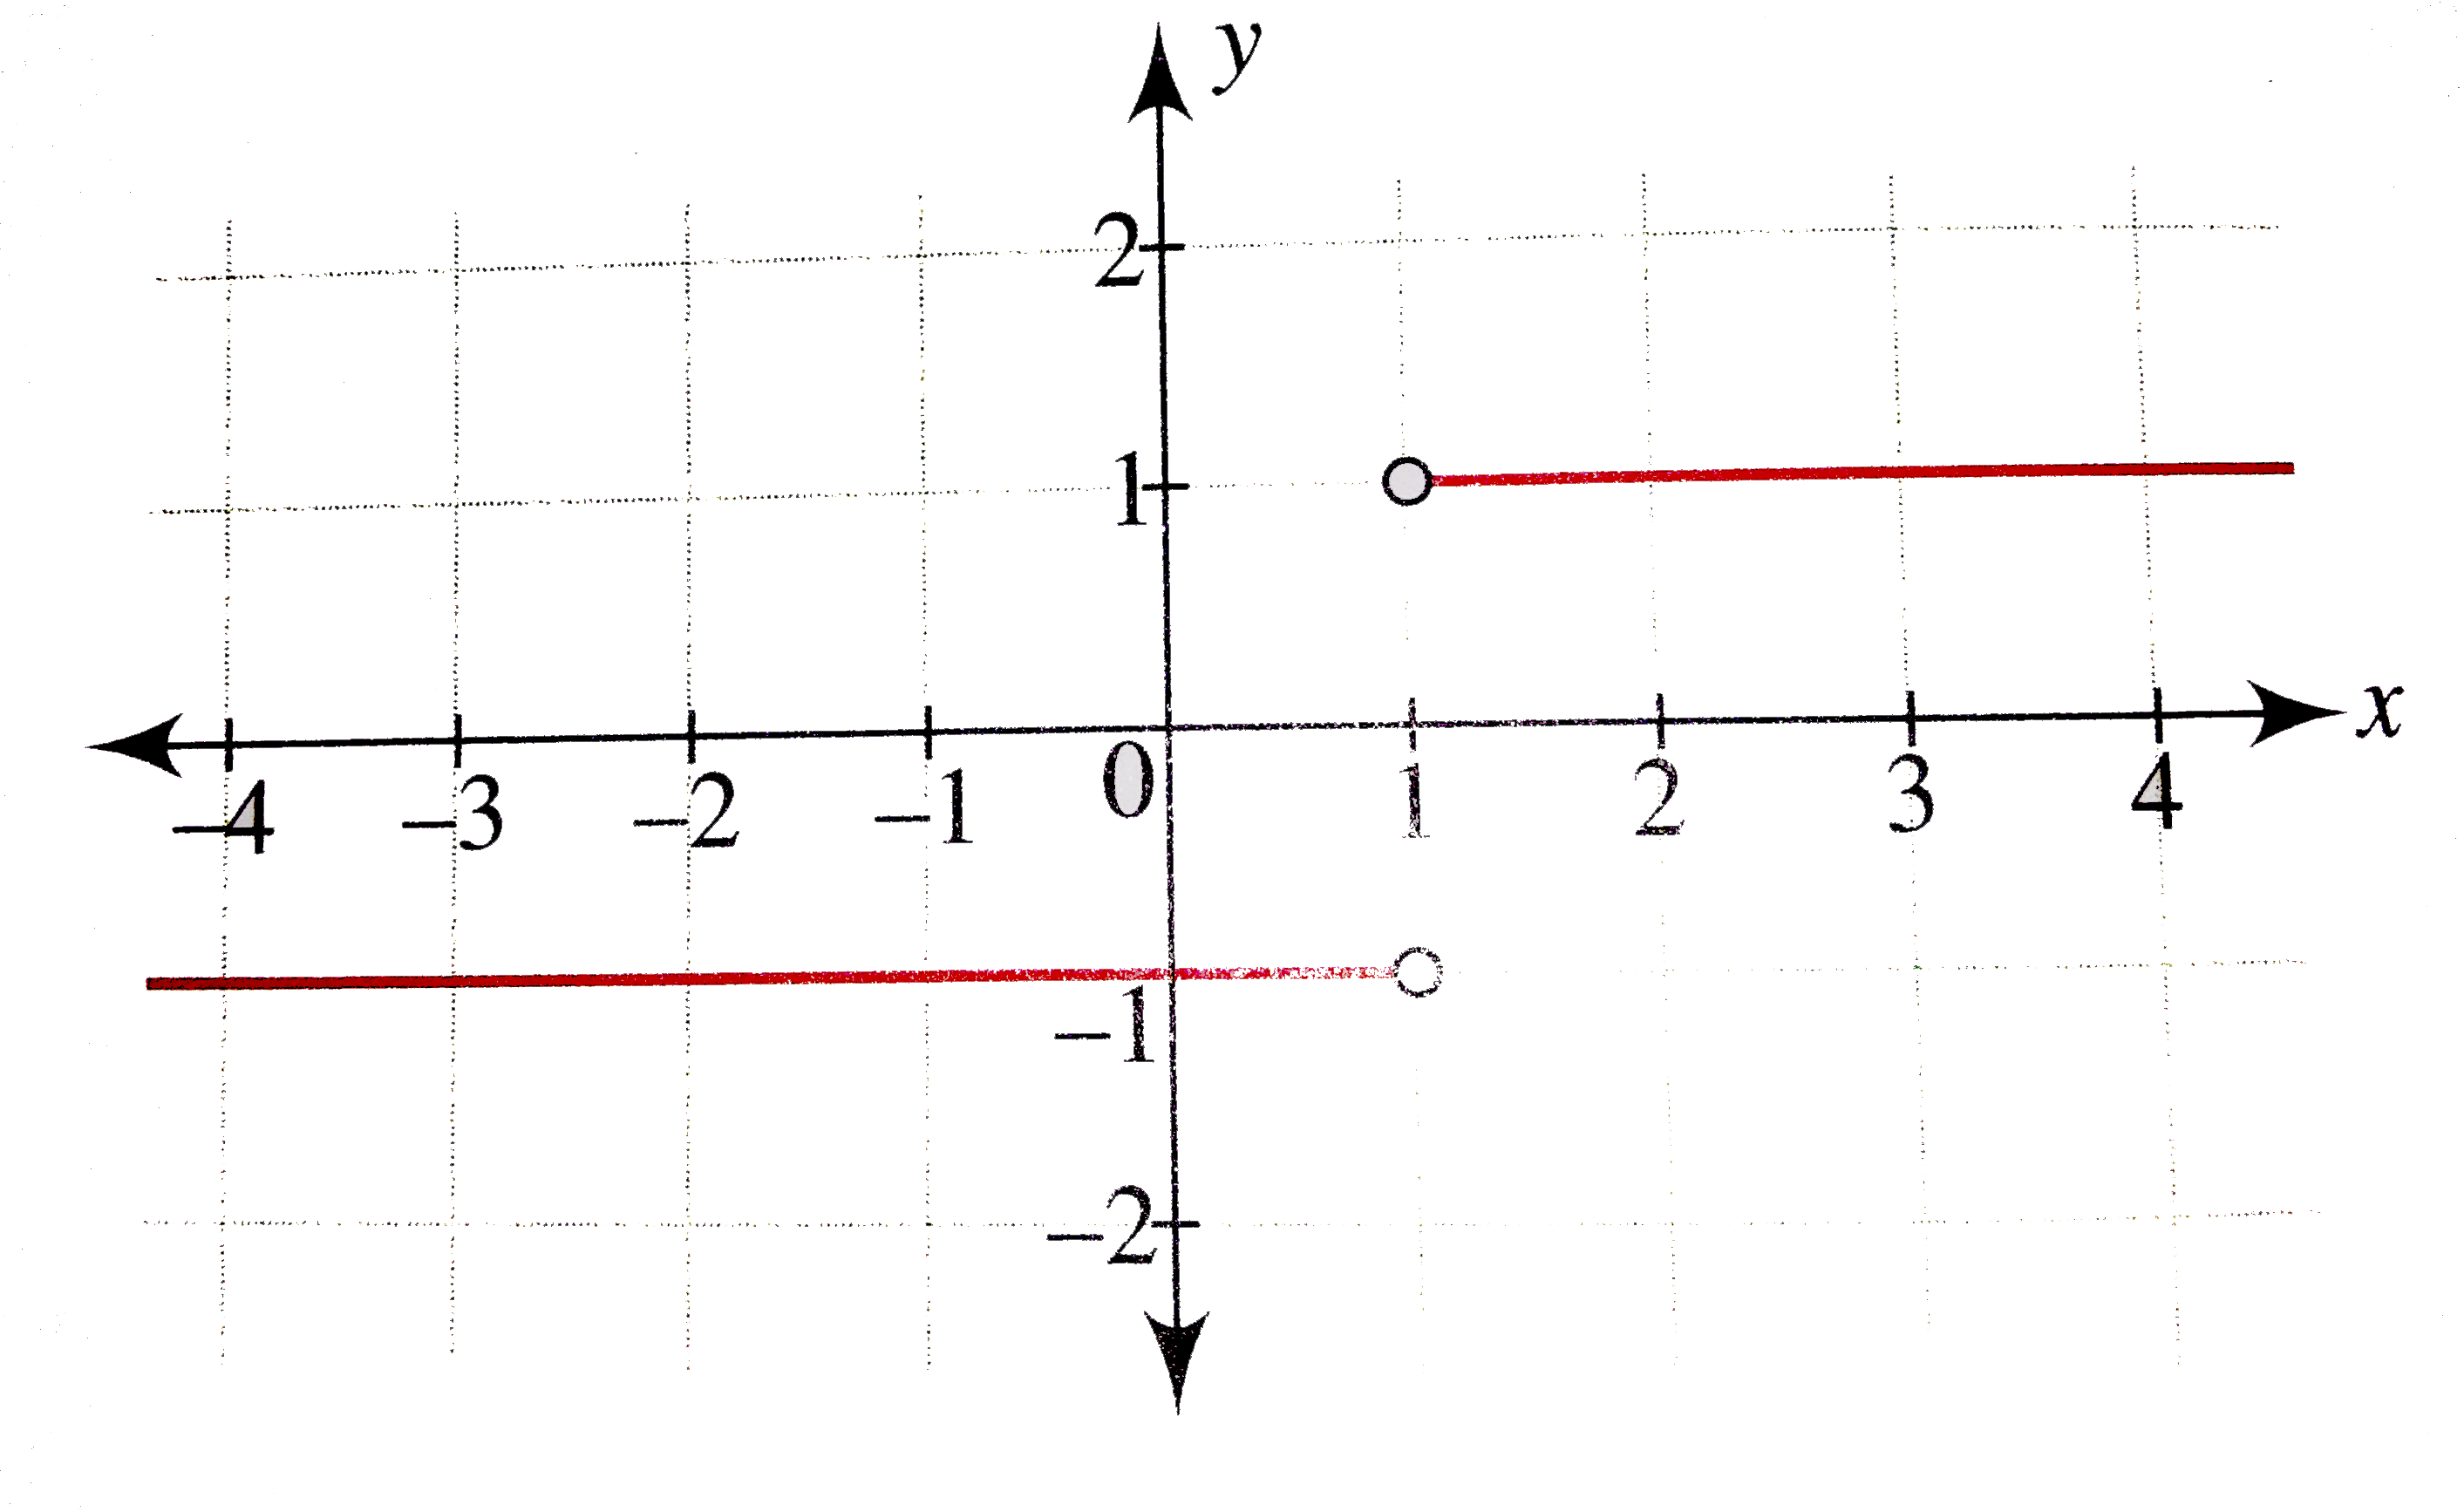
Draw the graph of f(x)=|x−1|x−1.
Video Solution
Text Solution
We have y=f(x)=|x−1|x−1
=⎧⎨⎩x−1x−1,x>11−xx−1,x<1
={1,x>1−1,x<1
Therefore, the graph of the function is the line y=1 for x>0 and the line y=−1 for x<1 as shown in the following figure.

|
Similar Questions
Draw the graph of f(x)=x|x|.
View SolutionDraw the graph of f(x)=(x+2)|x−1|.
View SolutionDraw the graph of f(x)=x2−3
View SolutionDraw the graph of y=f(x)=x+1x2+1
View SolutionDraw the graph of f(x)=(x−1)|(x−2)(x−3)|.
View SolutionDraw the graph of f(x)=|2x−1|+|2x−3|. Find the range of the function.
View SolutionDraw the graph of f(x)=|x−1|+|2x−3|. Find the range of the function.
View SolutionDraw the graph of f(x)=sec−1(secx)
View SolutionDraw the graph of y=x−1x−2.
View SolutionDraw the graph of y=√xx−1
View Solution
