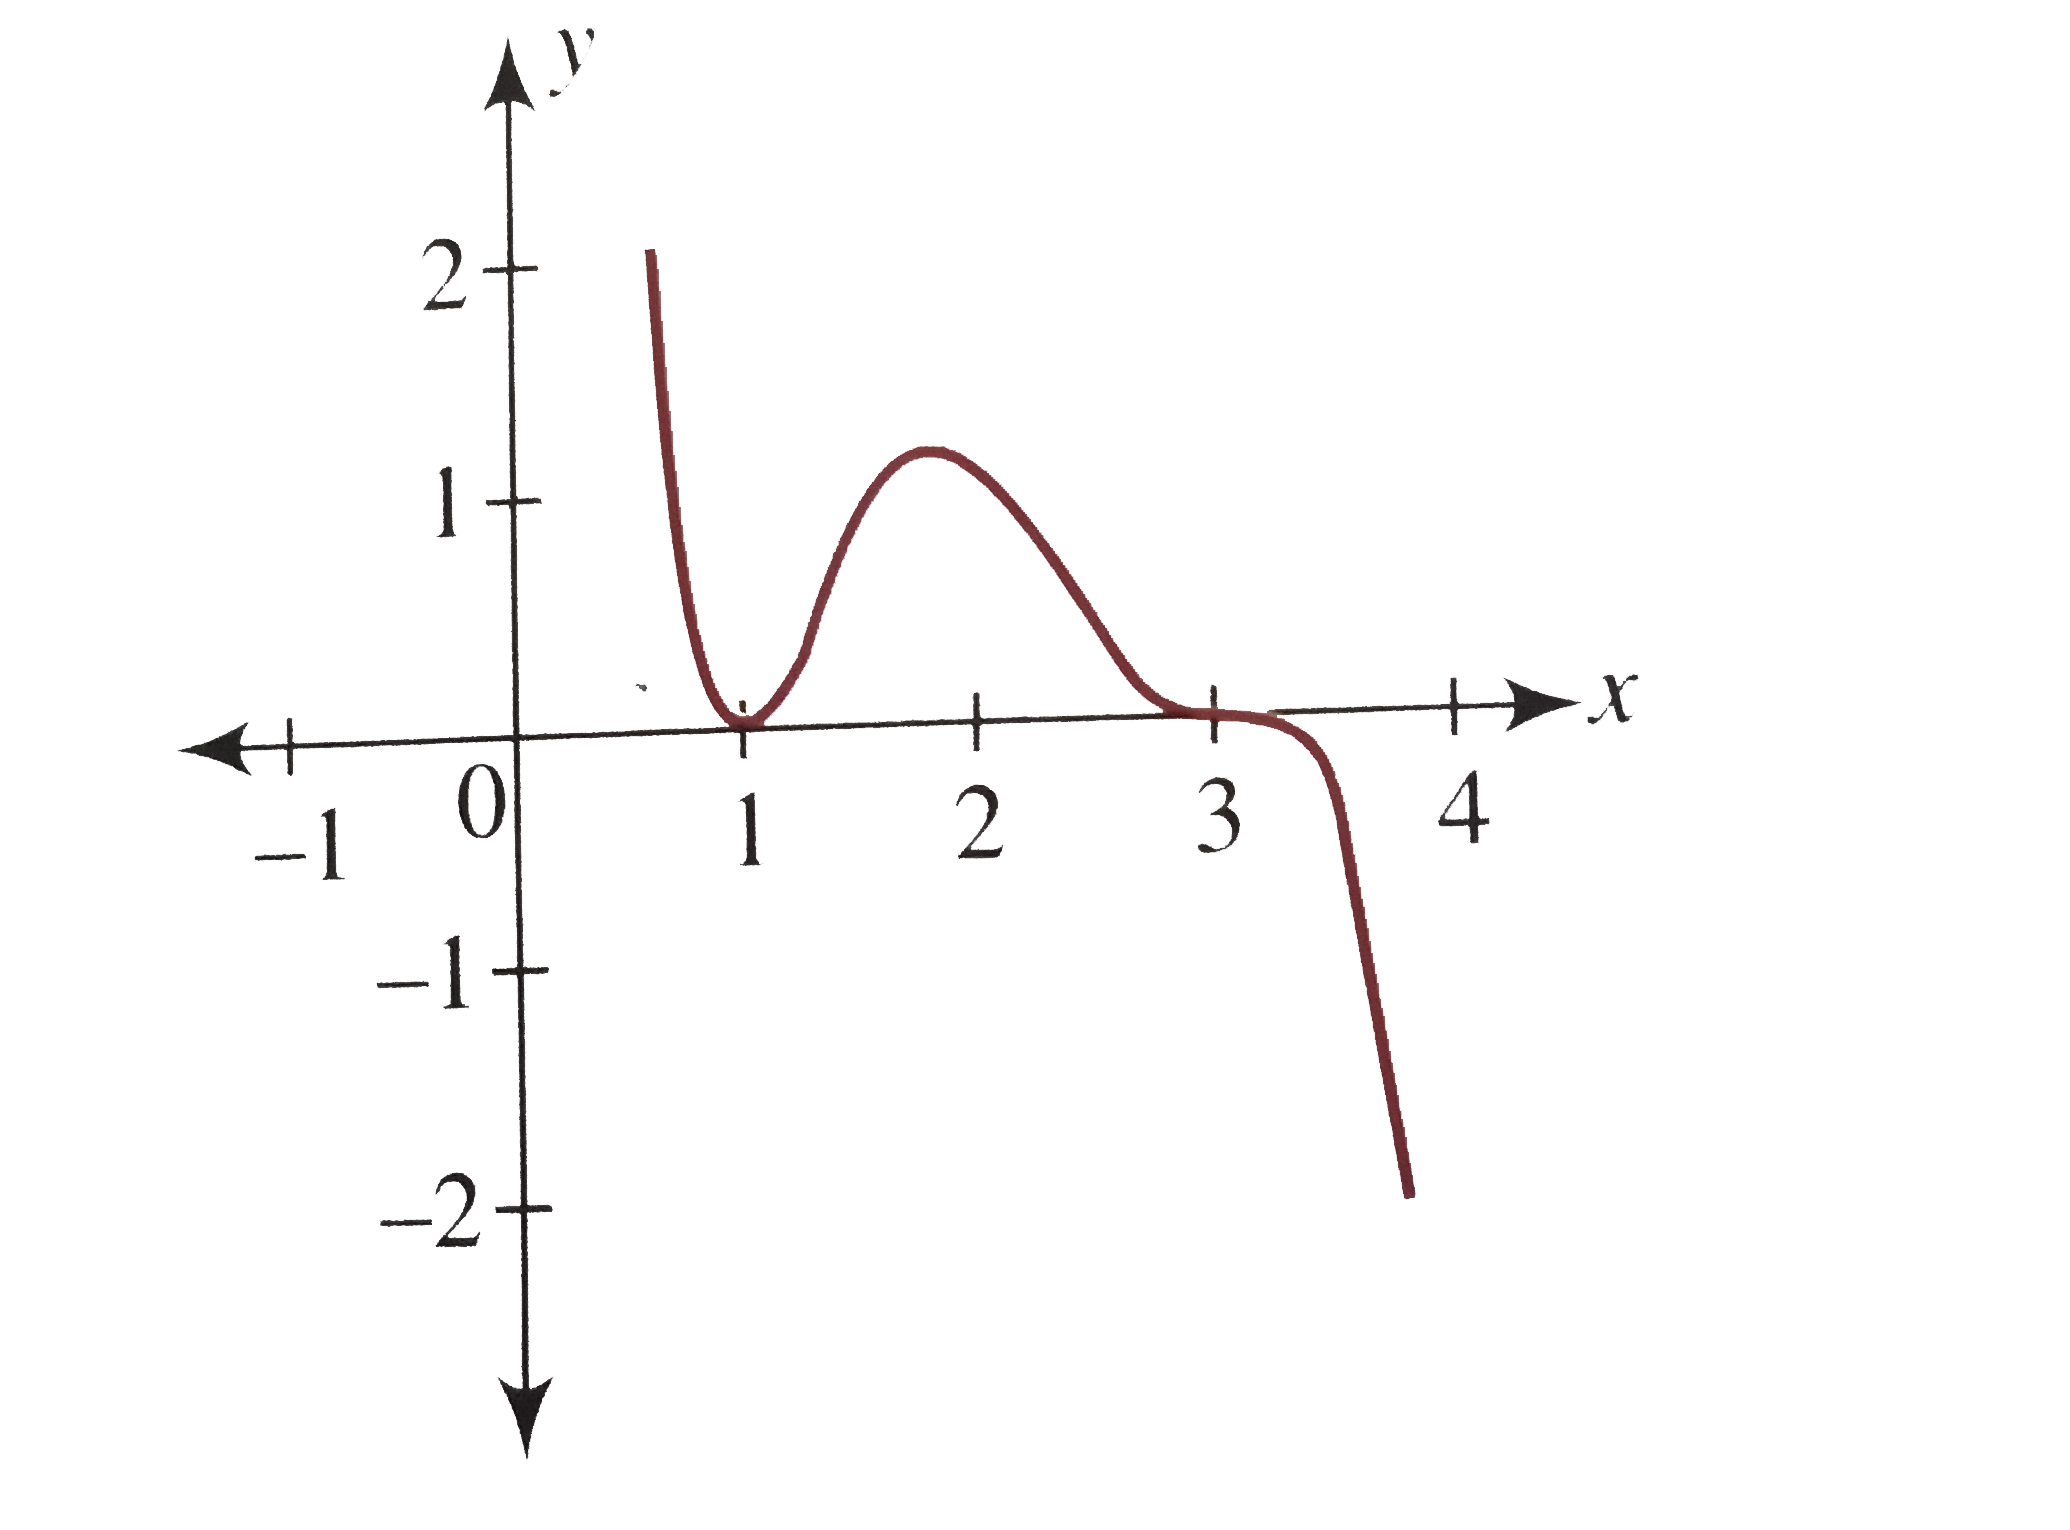
Draw the rough sketch of the curve y=(x−1)2(x−3)3.
Video Solution
Text Solution
We have y=f(x)=(x−1)2(3−x)3=−(x−1)2(x−3)3
The sign scheme of y=f(x) is as follows.

(x−3)3→ Curve crosses the x-axis at (3,0) and also touches the x-axis.
(x−1)2→ Curve does not cross the x-axis but touches the x-axis at (1,0).
Therefore, the graph of the function is as shown in the following figure.

|
Topper's Solved these Questions
- GRAPHS OF POLYNOMIAL AND RATIONAL FUNCTIONSBOOK - CENGAGE ENGLISHCHAPTER - GRAPHS OF POLYNOMIAL AND RATIONAL FUNCTIONSEXERCISE - Exercises
17 Videos
- GRAPHICAL TRANSFORMATIONSBOOK - CENGAGE ENGLISHCHAPTER - GRAPHICAL TRANSFORMATIONSEXERCISE - ILLUSTRATION
78 Videos
- GRAPHS OF ELEMENTARY FUNCTIONS BOOK - CENGAGE ENGLISHCHAPTER - GRAPHS OF ELEMENTARY FUNCTIONS EXERCISE - EXERCISES
34 Videos
Similar Questions
Draw the rough sketch of the curve y=(x−1)2(x−2)(x−3)3.
View SolutionDraw a rough sketch of the curve y=(x−1)2(x−2)(x−3)3
View SolutionDraw the rough sketch of the curve y=x4−x2.
View SolutionSketch the curve y=(x−1)(x−2)(x−3).
View SolutionSketch the curve |y|=(x−1)(x−2).
View SolutionSketch the curve |y|=(x−1)(x−2).
View SolutionSketch the curve |y|=(x−1)(x−2).
View SolutionDraw a rough sketch of the curve y=x2+3x+2x2−3x+2 and find the area of the bounded region between the curve and the x-axis.
View SolutionSketch the curve y=x3.
View SolutionSketch the curve y=x3−4x.
View Solution

