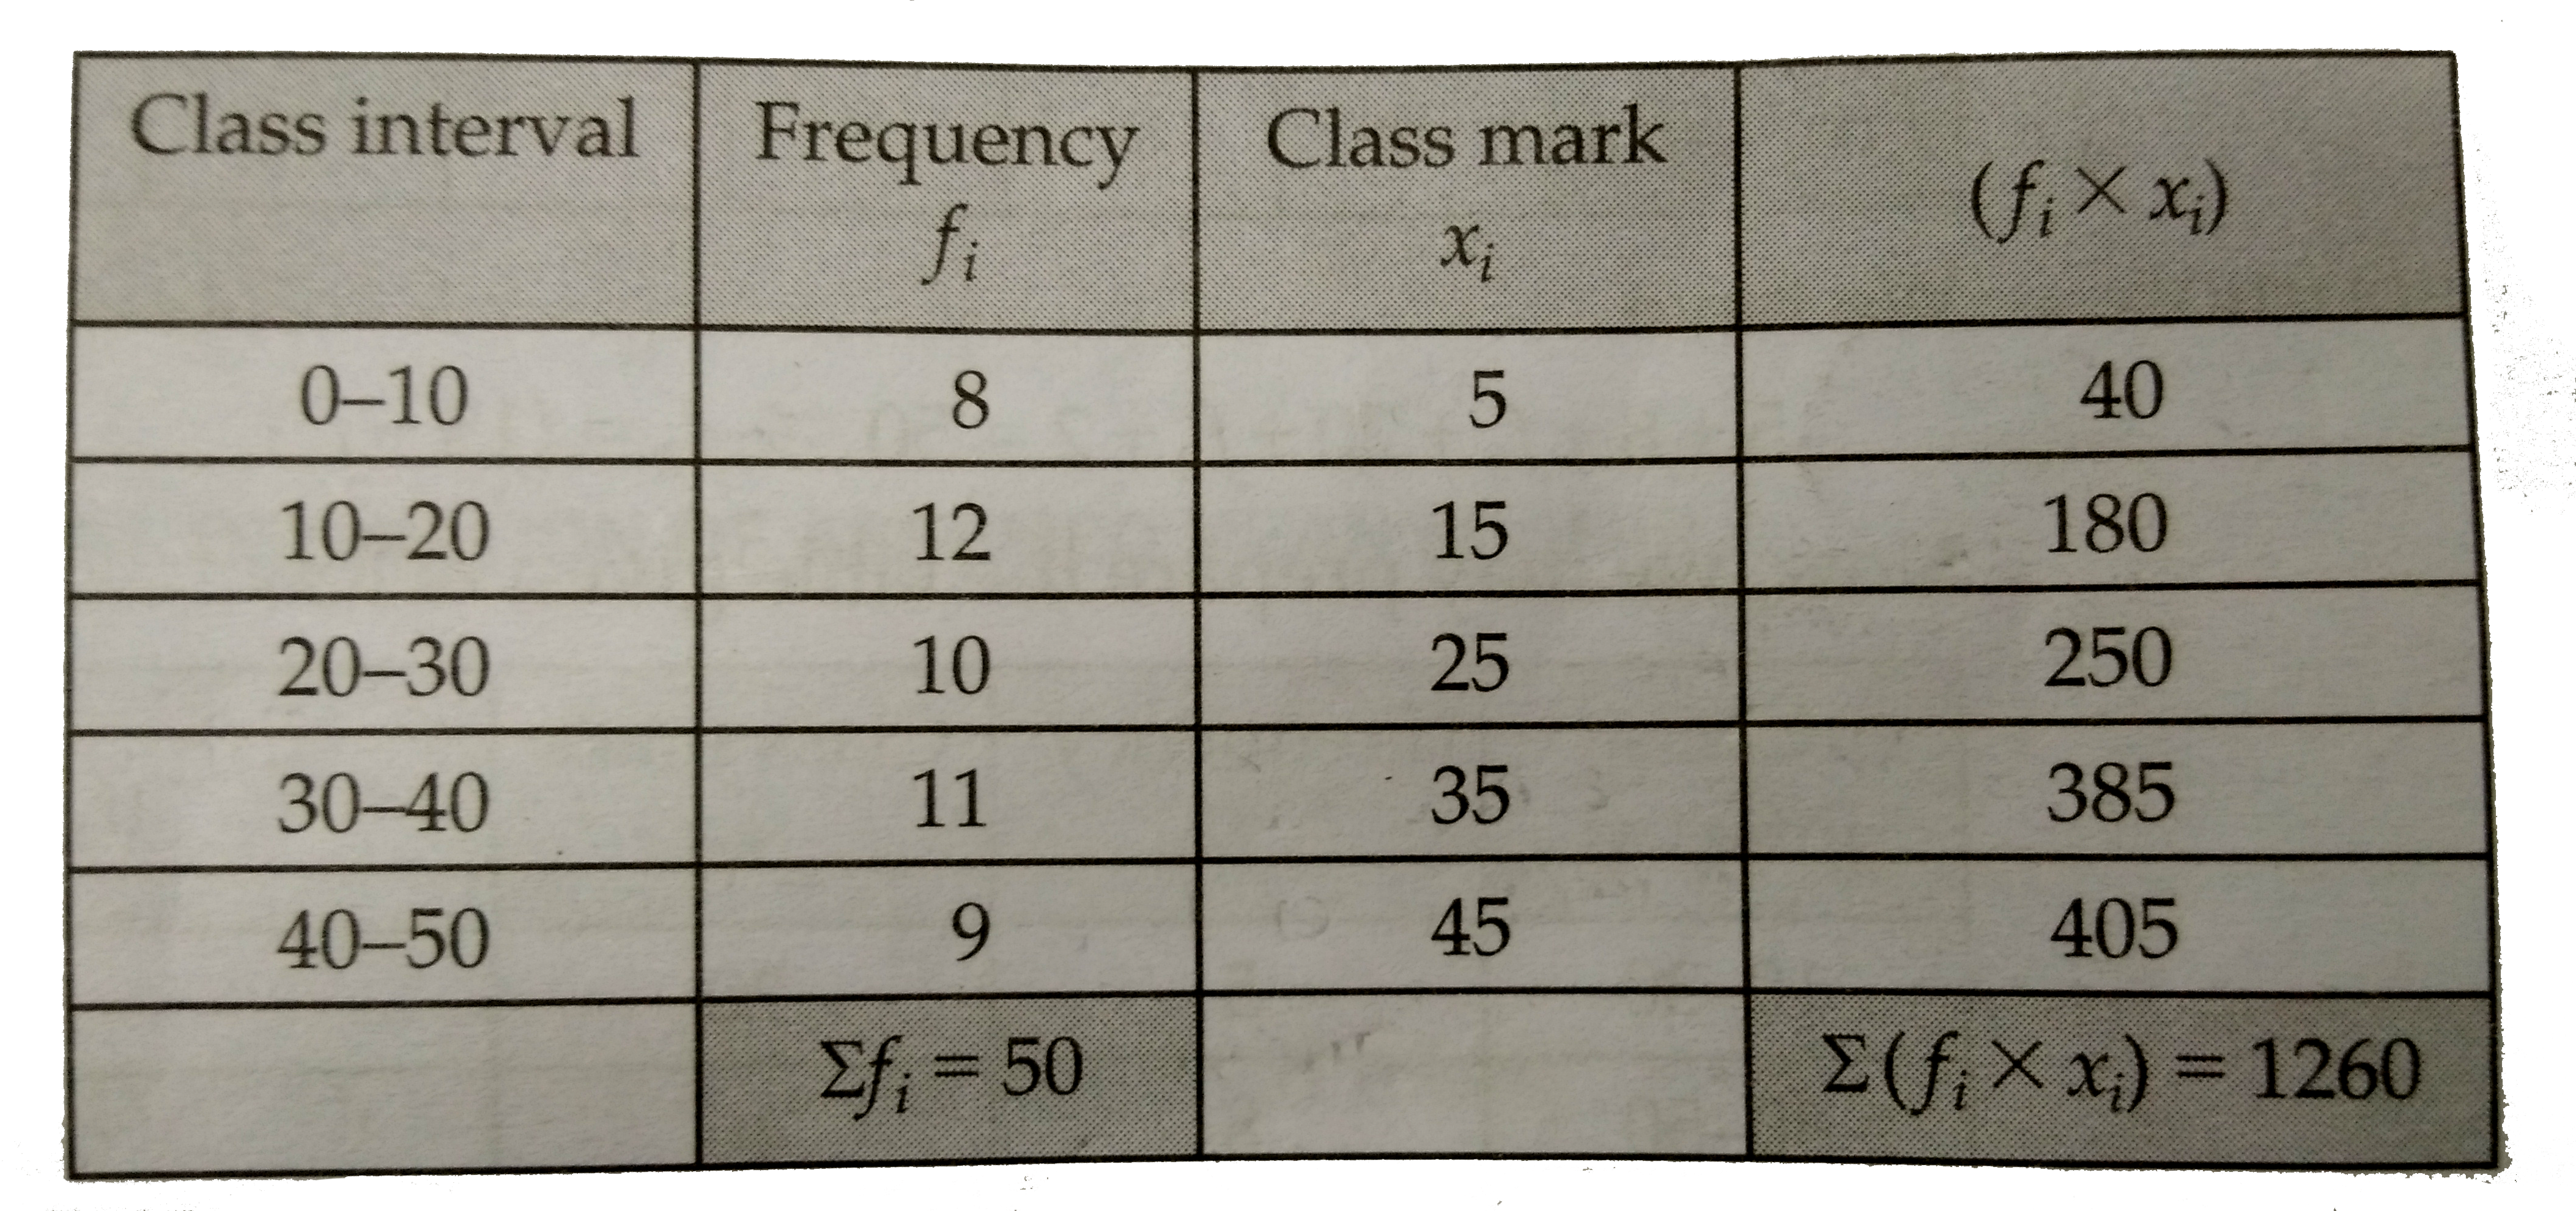
Find the mean of the following data

We may prepare the table as shown :

∴ mean =Σ(fi×xi)Σfi=126050=25.2
Topper's Solved these Questions
- MEAN,MEDAN,MODE OF GROUPED,DATA CUMULATIVE FREQUENCY GRAPH AND OGIVE Book:RS AGGARWALChapter:MEAN,MEDAN,MODE OF GROUPED,DATA CUMULATIVE FREQUENCY GRAPH AND OGIVE Exercise:SOLVED EXAMPLES
Explore 18 Videos
- MEAN,MEDAN,MODE OF GROUPED,DATA CUMULATIVE FREQUENCY GRAPH AND OGIVE Book:RS AGGARWALChapter:MEAN,MEDAN,MODE OF GROUPED,DATA CUMULATIVE FREQUENCY GRAPH AND OGIVE Exercise:MISCELLANEOUS QUESTIONS ON MEAN,MODE AND MEDIAN
Explore 1 Video
- LINEAR EQUATIONS IN TWO VARIABLES Book:RS AGGARWALChapter:LINEAR EQUATIONS IN TWO VARIABLES Exercise:QUESTION
Explore 2 Videos
- PERIMETER AND AREA OF PLANE FIGURES Book:RS AGGARWALChapter:PERIMETER AND AREA OF PLANE FIGURES Exercise:TEST YOURSELF (SHORT -ANSWER QUESTIONS)
Explore 1 Video
Similar Questions
Find the median of the following data

View Solution100 surnames were randomly picked up from a telephone directely and the distribution of the number of letters of the English alphabet in the surnames are obtained as follows

Determine the median and mean number of letters in the surnames .
Also, find the modal size of surnames
View SolutionThe age of Mr.X last year was the square of a number and it would be the cube of a number next year. What is the least number of years he must wait for his age to become the cube of a number again?
View SolutionFind the area of quad.ABCD in which AB=42,BC=21cm,CD=29cm,DA=34anddiag ,BD = 20 cm
View SolutionWhich of the following are correct chain isomers of butane ? (i)
View SolutionDetermine the point of symmetry of a regular hexagon.
View SolutionDtermine the images of the following figure about the given line :
View SolutionMatch the following Column A to Column B

View SolutionMatch the following Column A to Column B

View SolutionMatch the following Column A to Column B

View SolutionFind the area of figure given below.

View SolutionFind the perimeter of the figure given below.

View SolutionFind the area of the figure given below.

View SolutionThe inequation represented by the graph given below is :
View SolutionThe inequation that best describes the graph given below is _________
View SolutionThe inequation that best describes the following graph is _________
View Solution