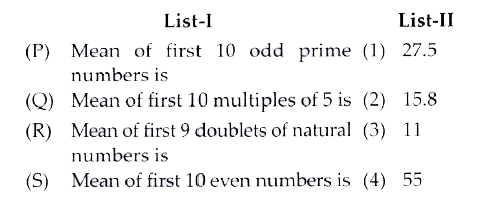
Find the mean of the of following distribution:

20.3
23.4
24.3
22.4
The correct Answer is:C
Step by step video & text solution for Find the mean of the of following distribution: by Maths experts to help you in doubts & scoring excellent marks in Class 9 exams.
Updated on:21/07/2023Topper's Solved these Questions
- STATISTICSBook:MTG IIT JEE FOUNDATIONChapter:STATISTICSExercise:Exercise (Match the following)
Explore 2 Videos
- STATISTICSBook:MTG IIT JEE FOUNDATIONChapter:STATISTICSExercise:Exercise (Assertion and Reason Type)
Explore 5 Videos
- STATISTICSBook:MTG IIT JEE FOUNDATIONChapter:STATISTICSExercise:NCERT SECTION (Exercise 14.4)
Explore 7 Videos
- QUADRILATERALS Book:MTG IIT JEE FOUNDATIONChapter:QUADRILATERALS Exercise:Olympiad/HOTS CORNER
Explore 15 Videos
- TRIANGLESBook:MTG IIT JEE FOUNDATIONChapter:TRIANGLESExercise:OLYMPAID/ HOTS CORNER
Explore 10 Videos
Similar Questions
Match the following

View SolutionAssertion : If the mean of five observations x, x + 2, x + 4, x + 6, x + 8 is 11, then mean of last three observations is 8.
Reason : Mean of n observations is equal to Sum of observations upon Number of observations
View SolutionThe following number of goals were scored by a team in a series of 10 matches: 2, 3, 4, 5, 0, 1, 3, 3, 4, 3
Find the mean, median and mode of these scores.
View SolutionThe length of the parallel sides of a trapezium are 14 cm and 7 cm. If the perpendicular distance between them is 8 cm, then the area of the trapezium is:
View SolutionIf ΔABC is an obtuse angled triangle in which ∠C=110∘ then which one of the following is true ?
View SolutionWhich of the following are correct chain isomers of butane ? (i)
View SolutionDetermine the point of symmetry of a regular hexagon.
View SolutionDtermine the images of the following figure about the given line :
View SolutionMatch the following Column A to Column B

View SolutionMatch the following Column A to Column B

View SolutionMatch the following Column A to Column B

View SolutionFind the area of figure given below.

View SolutionFind the perimeter of the figure given below.

View SolutionFind the area of the figure given below.

View SolutionThe inequation represented by the graph given below is :
View SolutionThe inequation that best describes the graph given below is _________
View Solution