If  represents solution set of a linear inequation in x on a number lline, then this solution can be written as:
−∞<x<1,x∈W
−∞<x≤1,x∈R
−∞≤x≤1,x∈R
−∞≤x≤1,x∈W
The correct Answer is:B
Topper's Solved these Questions
- LINEAR INEQUATIONSBook:ICSEChapter:LINEAR INEQUATIONSExercise:Assertion and Reason Based Questions
Explore 5 Videos
- LINEAR INEQUATIONSBook:ICSEChapter:LINEAR INEQUATIONSExercise:Competency Based Questions
Explore 15 Videos
- LINEAR INEQUATIONSBook:ICSEChapter:LINEAR INEQUATIONSExercise:QUESTIONS
Explore 22 Videos
- HEIGHTS AND DISTANCES Book:ICSEChapter:HEIGHTS AND DISTANCES Exercise:Exercise 22 C
Explore 28 Videos
- LOCI (LOCUS AND ITS CONSTRUCTIONS)Book:ICSEChapter:LOCI (LOCUS AND ITS CONSTRUCTIONS)Exercise:EXERCISE 16(B)
Explore 49 Videos
Similar Questions
Assertion :If the solution set of 5x + 4≤24 is {1,2,3,4}, then the replacement set of x is N.
Reason: In number system, the symbol N denotes the set of natural numbers i.e., 1, 2, 3, 4, 5,6.....
View SolutionTwo real numbers or two algebraic expressions related by the symbols >,<,≤or≥ form an inequation. If the highest power of the variables used in the inequation is 1, then the inequation is called linear inequation. For the linear inequation 3x−5≤8, answer teh following questions.
If x∈I, then the highest value of x is
View SolutionIf the replacement set is the of natural numbers (N), find the solution set of :
3x + 4 < 16
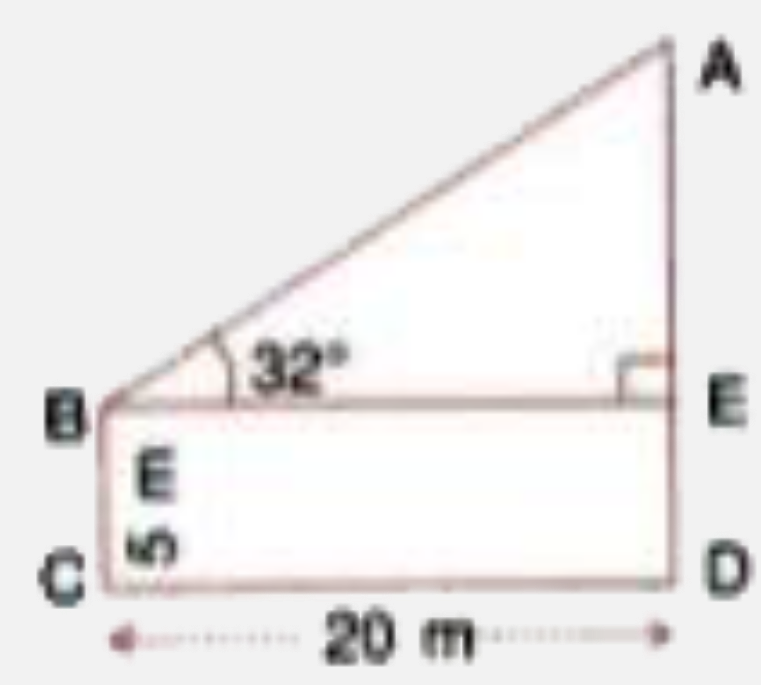
View SolutionFind AD

View SolutionThe locus of a point at a distance 3 cm from a fixed point.
View SolutionHow many lines of symmetry does the above figure have ?
View SolutionWhich of the following are correct chain isomers of butane ? (i)
View SolutionDetermine the point of symmetry of a regular hexagon.
View SolutionDtermine the images of the following figure about the given line :
View SolutionMatch the following Column A to Column B

View SolutionMatch the following Column A to Column B

View SolutionMatch the following Column A to Column B

View SolutionThe inequation represented by the graph given below is :
View SolutionThe inequation that best describes the graph given below is _________
View SolutionThe inequation that best describes the following graph is _________
View SolutionWhich inequations represent the shaded region in the given figure
View Solution
