If we interchange the lengths of the base and the height of a cuboid [Fig. (i)] to get another cuboid [Fig. (ii)], will its lateral surface area change?
![If we interchange the lengths of the base and the height of a cuboid [Fig. (i)] to get another cuboid [Fig. (ii)], will its lateral surface area change?](https://d10lpgp6xz60nq.cloudfront.net/physics_images/SWN_MAT_VIII_C11_E04_004_Q01.png) Solution in Punjabi
Solution in Punjabi
Step by step video solution for If we interchange the lengths of the base and the height of a cuboid [Fig. (i)] to get another cuboid [Fig. (ii)], will its lateral surface area change? by Maths experts to help you in doubts & scoring excellent marks in Class 8 exams.
Updated on:21/07/2023Topper's Solved these Questions
- MENSURATIONBOOK - SWAN PUBLICATIONCHAPTER - MENSURATIONEXERCISE - Exercise 11.1
4 Videos
- MENSURATIONBOOK - SWAN PUBLICATIONCHAPTER - MENSURATIONEXERCISE - Exercise 11.2
10 Videos
- MENSURATIONBOOK - SWAN PUBLICATIONCHAPTER - MENSURATIONEXERCISE - DO THIS
6 Videos
- LINEAR EQUATIONS IN ONE VARIABLE BOOK - SWAN PUBLICATIONCHAPTER - LINEAR EQUATIONS IN ONE VARIABLE EXERCISE - EXERCISE 2.6
14 Videos
- PLAYING WITH NUMBERSBOOK - SWAN PUBLICATIONCHAPTER - PLAYING WITH NUMBERSEXERCISE - Exercise 2
4 Videos
Similar Questions
A square and a rectangular field with measurements as given in the figure have the same perimeter.Which field has a larger area ?

View SolutionThe shape of top sufrace of a table is a trapezium.Find its area if its parallel sides are 1 m and 1.2 m and perpendicular distance between them is 0.8 m.
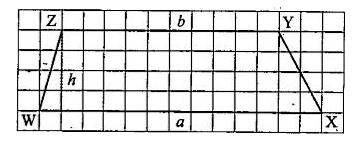
View SolutionDraw any trapezium WXYZ on a piece of graph paper as shown in the fig. and cut it out.

View SolutionSolve the following equations. 8x−33x=2
View SolutionIf 21y5 is a multiple of 3 ,where,y is a digit,what is the value of y.
View SolutionWhich of the following are correct chain isomers of butane ? (i)
View SolutionDetermine the point of symmetry of a regular hexagon.
View SolutionMatch the following Column A to Column B

View SolutionMatch the following Column A to Column B

View SolutionMatch the following Column A to Column B

View SolutionFind the area of the figure given below.

View SolutionThe inequation represented by the graph given below is :
View SolutionThe inequation that best describes the graph given below is _________
View SolutionThe inequation that best describes the following graph is _________
View SolutionIn Fig, find the value of x.
ltimg src="https://d10lpgp6xz60nq.cloudfront.net/physics_images/PS_MATH_IX_C12_S01_032_Q01.png" width="80%"gt
View SolutionMatch the followings (column I with column II)
ltimg src="https://d10lpgp6xz60nq.cloudfront.net/physics_images/NCERT_BIO_XI_C03_E01_011_Q01.png" width="80%"gt
View Solution
