In a study of the cases of diabetes the following data was obtained.

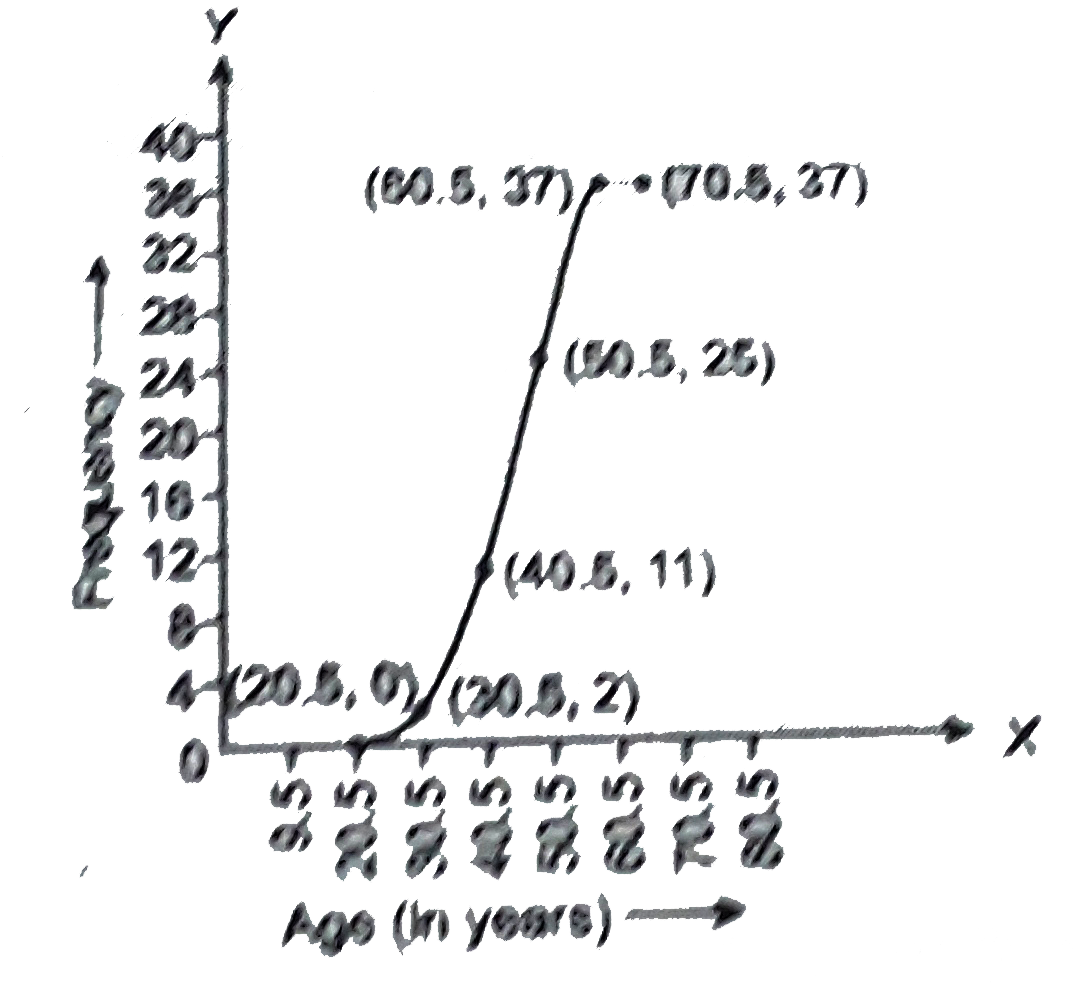
Draw a less than ogive for above data .
Text Solution
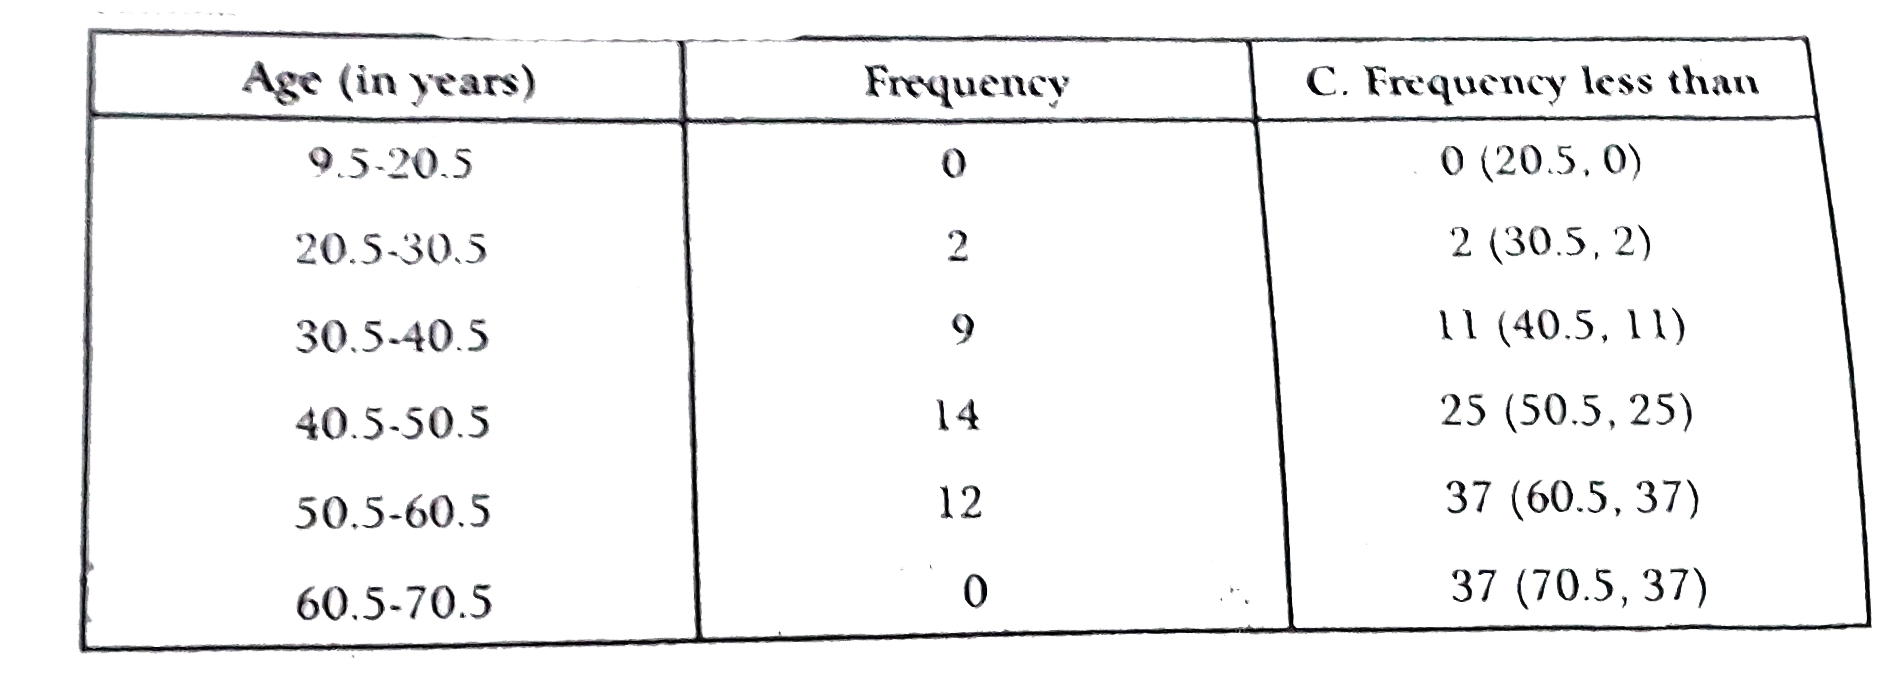
The given frequency distributions is discontinuous, to convert it into contiunuous distribution, we subtract 0.5 from lower limit and addd 0.5 to upper limit respectively. So, continuous comulative frequency distribution table is as below :

Required ogive is given below :

|
Similar Questions
Match the following Column A to Column B

View SolutionMatch the following Column A to Column B

View SolutionThe inequation represented by the graph given below is :
View SolutionThe inequation that best describes the graph given below is _________
View SolutionThe inequation that best describes the following graph is _________
View SolutionWhich inequations represent the shaded region in the given figure
View SolutionFrom the following figure, the correct observation is :- ltimg src="https://d10lpgp6xz60nq.cloudfront.net/physics_images/ALN_PHY_R03_E08_015_Q01.png" width="80%"gt
View SolutionMatch the followings (column I with column II)
ltimg src="https://d10lpgp6xz60nq.cloudfront.net/physics_images/NCERT_BIO_XI_C03_E01_011_Q01.png" width="80%"gt
View Solution
