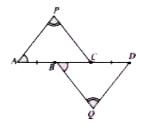
In figure AB=CD,∠PAC=∠QBD, Prove that ΔAPC≅ΔBQD

Step by step video solution for In figure AB=CD, anglePAC= angleQBD, Prove that DeltaAPC~=DeltaBQD by Maths experts to help you in doubts & scoring excellent marks in Class 9 exams.
Updated on:21/07/2023Topper's Solved these Questions
- TRIANGLESBook:MTG IIT JEE FOUNDATIONChapter:TRIANGLESExercise:SOLVED EXAMPLES
Explore 14 Videos
- TRIANGLESBook:MTG IIT JEE FOUNDATIONChapter:TRIANGLESExercise:NCERT SECTION (Exercise 7.1)
Explore 14 Videos
- STATISTICSBook:MTG IIT JEE FOUNDATIONChapter:STATISTICSExercise:Olympiad/HOTS Corner
Explore 20 Videos
Similar Questions
Prove that ΔABC is isosceles if median AD is perpendicular to BC.
View SolutionIn quadrilateral ABCD, AC=AD and AB bisects ∠A (see figure). Show that ΔABC≅ΔABD. What can you say about BC and BD ?

View SolutionThe weight (in kg) of 50 students are given below
40 45 55 62 50 51 56 69 61 36
60 56 69 38 35 63 57 50 57 48
40 63 53 64 47 42 56 51 42 60
55 39 64 57 64 44 66 35 59 59
73 62 49 63 37 63 54 72 44 60
Find the mean, median and mode respectively for the given data.
View SolutionIn the given figure (not to scale), O is the centre of the circle. A,B,C and D are concyclic and AB=CD . If /_MON =120^(@) , then find /_ OPN .
View SolutionHow many lines of symmetry does the above figure have ?
View SolutionDetermine the point of symmetry of a regular hexagon.
View SolutionDtermine the images of the following figure about the given line :
View SolutionIn the figure above (not to scale), ¯¯¯¯¯¯AB⊥¯¯¯¯¯¯CDandAD is the bisector of ∠BAE.AB=3cm and AC=5cm. Find CD.
View SolutionMatch the following Column A to Column B

View SolutionMatch the following Column A to Column B

View SolutionMatch the following Column A to Column B

View SolutionFind the area of figure given below.

View SolutionFind the perimeter of the figure given below.

View SolutionThe inequation represented by the graph given below is :
View SolutionThe inequation that best describes the graph given below is _________
View SolutionThe inequation that best describes the following graph is _________
View Solution