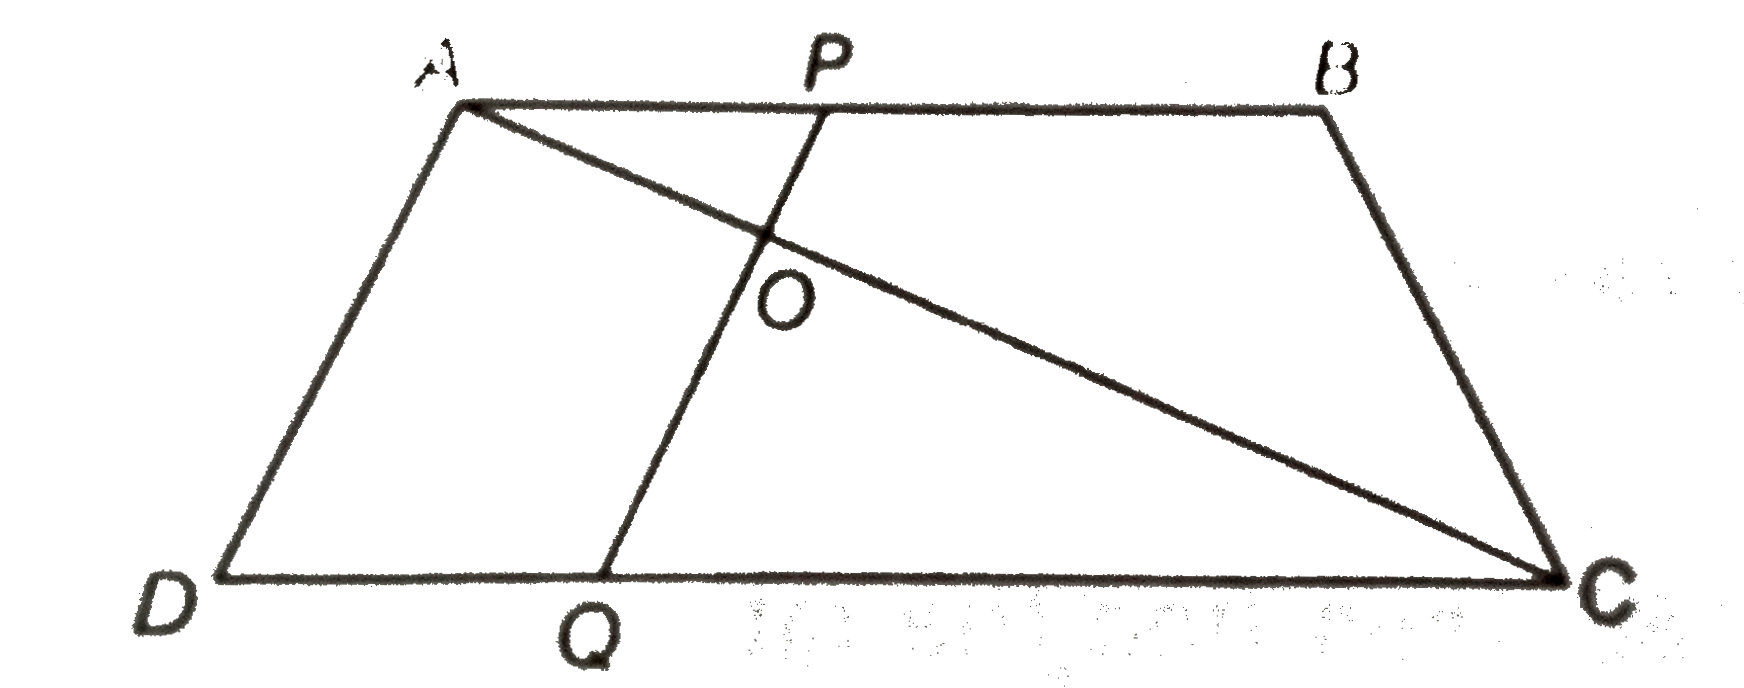
In figure , if Ab||DC and AC, PQ interrest each other at the point 0. Prove that OA.CQ=OC.AP.

Given AC and PQ intersect each other at the point O and AB||DC.
To prove OA.CQ=OC.AP
Proof In ΔAOPandΔCOQ ∠AOP=∠COQ [vertically opposite angle]
∠APO=∠CQO
[Since, AB||DC and PQ is transversal, so alternate angles]
∴ΔAOP~ΔCOQ [by AAA similarity angles]
Then, OAOC=APCQ {Since, corresponding sides are proportioonal]
⇒OA⋅CQ=OC⋅AP Hence proved.
Topper's Solved these Questions
- TRIANGLESBOOK - NCERT EXEMPLAR ENGLISHCHAPTER - TRIANGLESEXERCISE - Long Answer Type Questions
18 Videos
- TRIANGLESBOOK - NCERT EXEMPLAR ENGLISHCHAPTER - TRIANGLESEXERCISE - Very Short Answer Typw Questions
12 Videos
- SURFACE AREAS AND VOLUMESBOOK - NCERT EXEMPLAR ENGLISHCHAPTER - SURFACE AREAS AND VOLUMESEXERCISE - LONG ANSWER TYPE QUESTIONS
20 Videos
Similar Questions
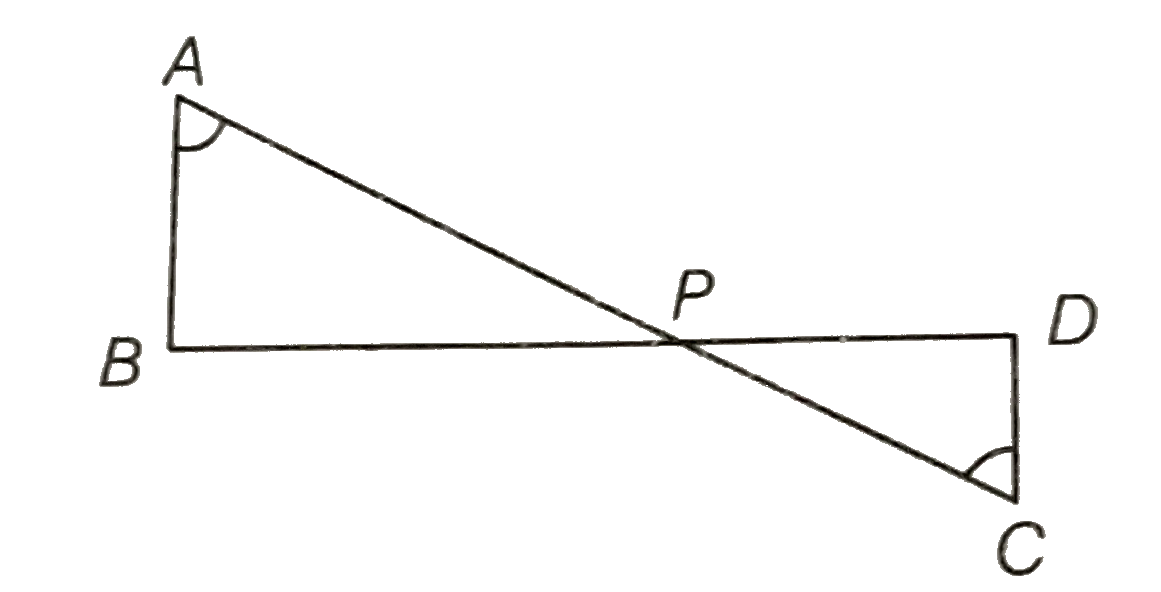
In given figure, if ∠A=∠C, AB= 6 cm, BP = 15 cm, AP = 12 cm and CP= 4 cm, then find the lengths of PD and CD.

View SolutionIs the triangle with sides 25 cm, 5 cm and 24 cm a right triangle? Give reason for your answer.
View SolutionA hemisphere of lead of radius 8cm is cast into a right circular cone of base radius 6cm. Determine the height of the cone, correct to two places of decimal.
View SolutionIn figure , if AB||DC and AC, PQ intersect each other at the point O. Prove that OA.CQ=OC.AP.

View SolutionHow many lines of symmetry does the above figure have ?
View SolutionDetermine the point of symmetry of a regular hexagon.
View SolutionDtermine the images of the following figure about the given line :
View SolutionMatch the following Column A to Column B

View SolutionMatch the following Column A to Column B

View SolutionMatch the following Column A to Column B

View SolutionFind the area of the figure given below.

View SolutionThe area of the shaded part in the figure given below is ______.

View SolutionThe inequation represented by the graph given below is :
View SolutionThe inequation that best describes the graph given below is _________
View SolutionThe inequation that best describes the following graph is _________
View Solution
