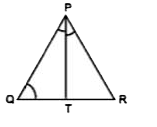
In the ΔPQT−ΔRPT by which of the following similarity crtierion ?

SAS
ASA
AA
SSS
The correct Answer is:C
Topper's Solved these Questions
- SIMILARITY BOOK - ICSECHAPTER - SIMILARITY EXERCISE - MULTIPLE CHOICE QUESTIONS (ASSERTION AND REASON BASED QUESTIONS)
5 Videos
- SIMILARITY BOOK - ICSECHAPTER - SIMILARITY EXERCISE - MULTIPLE CHOICE QUESTIONS (COMPETENCY BASED QUESTIONS)
10 Videos
- SHARES AND DIVIDENDSBOOK - ICSECHAPTER - SHARES AND DIVIDENDSEXERCISE - Exercise 3(C )
20 Videos
- SIMILARITY (WITH APPLICATIONS TO MAPS AND MODELS)BOOK - ICSECHAPTER - SIMILARITY (WITH APPLICATIONS TO MAPS AND MODELS)EXERCISE - EXERCISE 15(E)
61 Videos
Similar Questions
Assertion : If in two triangles ABC and PQR, ΔABC~ΔPQR with ∠A=45∘and∠B=60∘, then ∠R=75∘.
Reason : If two triangles are similar, then their corresponding angles are equal.
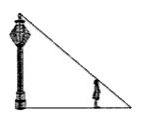
View SolutionA girl, named Ritika of height 90 cm is walking away from the ase of a lamp-post, She observes the shadows of lamp-post and herself and relate it with a chapter of mathematics, she studied in her last class.

On the basis of information, answer the following question

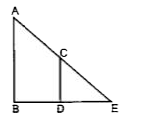
The triangles ABE and CDE are similar by which of the following similarity rule ?
View SolutionBy investing 45000rs in 10% 100rs shares, Shared gets 3000rs as dividend. Find the market value of each share.
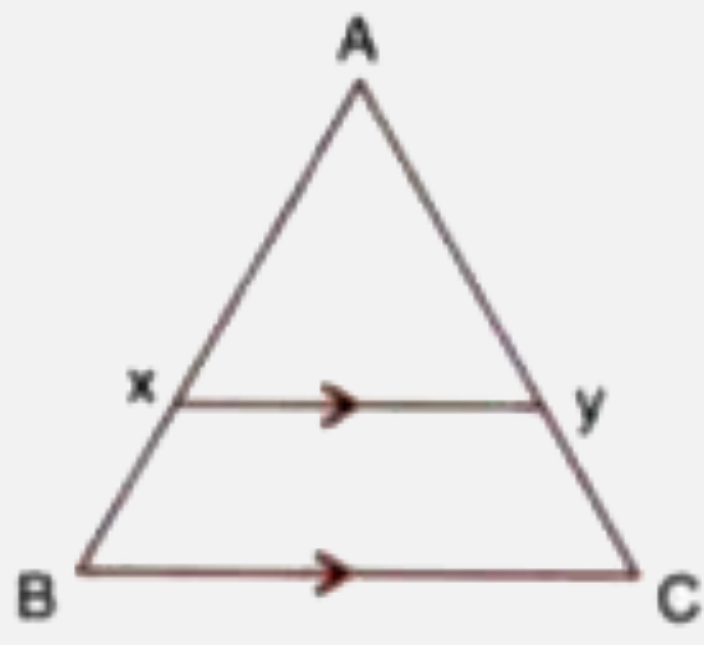
View SolutionIn the following figure, XY is parallel to BC,AX=9cm,XB=4.5cmandBC=18cm.

AYYC
View SolutionMatch the following lists:

View SolutionHow many lines of symmetry does the above figure have ?
View SolutionWhich of the following are correct chain isomers of butane ? (i)
View SolutionDetermine the point of symmetry of a regular hexagon.
View SolutionDtermine the images of the following figure about the given line :
View SolutionMatch the following Column A to Column B

View SolutionMatch the following Column A to Column B

View SolutionMatch the following Column A to Column B

View SolutionThe inequation represented by the graph given below is :
View SolutionThe inequation that best describes the graph given below is _________
View SolutionThe inequation that best describes the following graph is _________
View SolutionWhich inequations represent the shaded region in the given figure
View Solution
