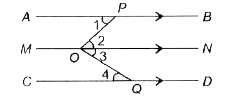
In the given figure (not drawn to scale), ∠APO=42∘and∠CQO=38∘. Find the value of ∠POQ.

68∘
72∘
80∘
126∘
The correct Answer is:C
Step by step video & text solution for In the given figure (not drawn to scale), angleAPO= 42^(@) and angleCQO= 38^(@). Find the value of anglePOQ. by Maths experts to help you in doubts & scoring excellent marks in Class 9 exams.
Updated on:21/07/2023Topper's Solved these Questions
- LINES AND ANGLESBOOK - SCIENCE OLYMPIAD FOUNDATION CHAPTER - LINES AND ANGLESEXERCISE - Achievers Section (HOTS)
3 Videos
- LINEAR EQUATIONS IN TWO VARIABLES BOOK - SCIENCE OLYMPIAD FOUNDATION CHAPTER - LINEAR EQUATIONS IN TWO VARIABLES EXERCISE - ACHIEVERS SECTION (HOTS)
2 Videos
- LOGICAL REASONING BOOK - SCIENCE OLYMPIAD FOUNDATION CHAPTER - LOGICAL REASONING EXERCISE - NON-VERBAL REASONING
9 Videos
Similar Questions
Fill in the blanks
(a) Angles forming a linear pair are ____(P) angles.
(b) The angle between the bisectors of the two acute angles of a right-angled triangle is of measure ____(Q)
(c ) Sum of interior angles of a quadrilateral is ____(R)
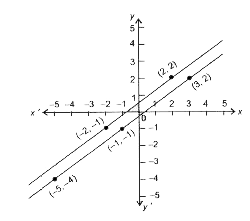
View SolutionThe equation representing the given graph is ______.

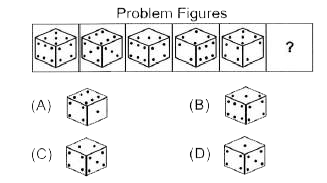
View SolutionWhich of the following figures will continue the same series as established by the Problem Figures ?

View SolutionIn the given figure (not to scale), O is the centre of the circle. A,B,C and D are concyclic and AB=CD . If /_MON =120^(@) , then find /_ OPN .
View SolutionHow many lines of symmetry does the above figure have ?
View SolutionDetermine the point of symmetry of a regular hexagon.
View SolutionDtermine the images of the following figure about the given line :
View SolutionMatch the following Column A to Column B

View SolutionMatch the following Column A to Column B

View SolutionMatch the following Column A to Column B

View SolutionFind the area of figure given below.

View SolutionFind the perimeter of the figure given below.

View SolutionFind the area of the figure given below.

View SolutionThe area of the shaded part in the figure given below is ______.

View SolutionThe inequation represented by the graph given below is :
View SolutionThe inequation that best describes the graph given below is _________
View Solution

