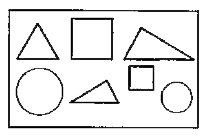
See the fgure and find the ratio of
Number of triangles to the number of cirlces inside the rectangle.
 Solution in Punjabi
The correct Answer is:3:2
Step by step video & text solution for See the fgure and find the ratio of Number of triangles to the number of cirlces inside the rectangle. by Maths experts to help you in doubts & scoring excellent marks in Class 6 exams.
Updated on:21/07/2023Topper's Solved these Questions
- RATIO AND PROPORTION BOOK - NAND LAL PUBLICATIONCHAPTER - RATIO AND PROPORTION EXERCISE - EXERCISE - 12.2
21 Videos
- RATIO AND PROPORTION BOOK - NAND LAL PUBLICATIONCHAPTER - RATIO AND PROPORTION EXERCISE - EXERCISE - 12.3
9 Videos
- RATIO AND PROPORTION BOOK - NAND LAL PUBLICATIONCHAPTER - RATIO AND PROPORTION EXERCISE - SAMPLE PAPER FOR PRACTICE
13 Videos
- PRACTICAL GEOMETRY BOOK - NAND LAL PUBLICATIONCHAPTER - PRACTICAL GEOMETRY EXERCISE - SAMPLE PAPER FOR PRACTICE
18 Videos
- SYMMETRYBOOK - NAND LAL PUBLICATIONCHAPTER - SYMMETRYEXERCISE - SAMPLE PAPER FOR PRACTICE
8 Videos
Similar Questions
Determine if the following are in proportion:
15,45,40,120
View SolutionIf the cost of 7m of cloth is Rs.294,find the cost of 5m of cloth.
View SolutionFind the number which has the same ratio to 32 as 18 has to 24?
View SolutionTo construct an angle of 221∘2 we
View SolutionWhich of the two figures are the images of each other ( mirror line is the dotted line )

View SolutionWhich of the following are correct chain isomers of butane ? (i)
View SolutionDetermine the point of symmetry of a regular hexagon.
View SolutionDtermine the images of the following figure about the given line :
View SolutionMatch the following Column A to Column B

View SolutionMatch the following Column A to Column B

View SolutionMatch the following Column A to Column B

View SolutionFind the area of figure given below.

View SolutionFind the perimeter of the figure given below.

View SolutionFind the area of the figure given below.

View SolutionThe inequation represented by the graph given below is :
View SolutionThe inequation that best describes the graph given below is _________
View Solution
