State True or False:
The measures of central tendency may not lie between the maximum and minimum values of data.
To determine whether the statement "The measures of central tendency may not lie between the maximum and minimum values of data" is true or false, we can analyze the concepts of measures of central tendency (mean, median, and mode) and their relationship to the range of data.
1. Understanding Measures of Central Tendency:
- Measures of central tendency include the mean, median, and mode. These values are used to summarize a set of data by identifying the central point within that dataset.
2. Identifying Maximum and Minimum Values:
- In any given dataset, the maximum value is the highest number, and the minimum value is the lowest number. All other values in the dataset fall between these two extremes.
3. Analyzing the Mean:
- The mean (average) is calculated by adding all the values in the dataset and dividing by the number of values. Since the mean is derived from the values in the dataset, it will always fall between the minimum and maximum values.
4. Analyzing the Median:
- The median is the middle value when the data is arranged in ascending order. If there is an odd number of values, the median is the exact middle value. If there is an even number of values, the median is the average of the two middle values. In either case, the median will also lie between the minimum and maximum values.
5. Analyzing the Mode:
- The mode is the value that appears most frequently in the dataset. Depending on the distribution of the data, the mode can also fall between the minimum and maximum values. However, it is possible for the mode to be equal to the minimum or maximum value, but it cannot exceed these limits.
6. Conclusion:
- Since all measures of central tendency (mean, median, and mode) either lie within the range of the minimum and maximum values or are equal to them, the statement that "the measures of central tendency may not lie between the maximum and minimum values of data" is False.
Final Answer:
False
- Measures of central tendency include the mean, median, and mode. These values are used to summarize a set of data by identifying the central point within that dataset.
- In any given dataset, the maximum value is the highest number, and the minimum value is the lowest number. All other values in the dataset fall between these two extremes.
- The mean (average) is calculated by adding all the values in the dataset and dividing by the number of values. Since the mean is derived from the values in the dataset, it will always fall between the minimum and maximum values.
- The median is the middle value when the data is arranged in ascending order. If there is an odd number of values, the median is the exact middle value. If there is an even number of values, the median is the average of the two middle values. In either case, the median will also lie between the minimum and maximum values.
- The mode is the value that appears most frequently in the dataset. Depending on the distribution of the data, the mode can also fall between the minimum and maximum values. However, it is possible for the mode to be equal to the minimum or maximum value, but it cannot exceed these limits.
- Since all measures of central tendency (mean, median, and mode) either lie within the range of the minimum and maximum values or are equal to them, the statement that "the measures of central tendency may not lie between the maximum and minimum values of data" is False.
False
टॉपर्स ने हल किए ये सवाल
- DATA HANDLINGBOOK - NCERT EXEMPLARCHAPTER - DATA HANDLINGEXERCISE - EXERCISE
42 Videos
- DATA HANDLINGBOOK - NCERT EXEMPLARCHAPTER - DATA HANDLINGEXERCISE - THINK AND DISCUSS
3 Videos
- DATA HANDLINGBOOK - NCERT EXEMPLARCHAPTER - DATA HANDLINGEXERCISE - EXERCISE(FILL IN THE BLANKS)
15 Videos
- COMPARING QUANTITIESBOOK - NCERT EXEMPLARCHAPTER - COMPARING QUANTITIESEXERCISE - THINK AND DISCUSS
24 Videos
- EXPONENTS AND POWERSBOOK - NCERT EXEMPLARCHAPTER - EXPONENTS AND POWERSEXERCISE - EXERCISE
136 Videos
समान प्रश्न
Calculate the Mean, Median and Mode of the following data: 5, 10, 10, 12, 13. Are these three equal ?
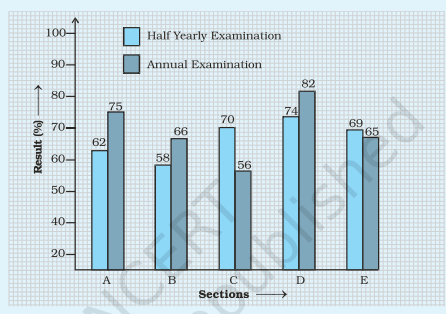
View SolutionThe double bar graph given below compares the class-averages in half yearly and annual examinations of 5 sections of Class VII.

Can you compare the ratio of difference of results of sections B and D ?
View SolutionThe difference between the highest and the lowest observations in a data is its
View SolutionDescribe how two ratios can form a proportion.
View Solution[(−3)2]3 is equal to
View SolutionEmpiricla relationship between the three measures of central tendency is
View Solutionकिसी वितरण के लिये केंद्रीय प्रवृत्ति कि मापो में सम्बन्ध है-
View Solutionआंकड़ों के अधिकतम एवं न्यूनतम मानो का अन्तर आंकड़ों का …………. कहलाता है।
View SolutionThere is a relationship between three measures of central tendency -
View SolutionThe measure of central tendency influenced by extreme values is
View SolutionEmpiricla relationship between the three measures of central tendency is
View Solutionआँकड़ों के अधिकतम और न्यूनतम मानों के अंतर को क्या कहा जाता है ?
View SolutionTrue/false:
If all the values lie between two numbers then their harmonic mean may or may not lie between the same numbers.
View SolutionThe measure of central tendency which take into account all data terms is
View Solutionकेन्द्रीय प्रवृत्तियों की तीन मापों के बीच प्रायोगिक सम्बन्ध है -
View Solution
