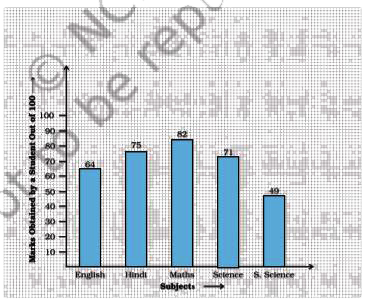
Study the bar graph given below and answer the questions that follow

(a) What information is depicted from the bar graph?
(b) In which subject is the student very good?
(c) Calculate the average marks of the student.
(d) If 75 and above marks denote a distinction, then name the subjects in which the student got distinction.
(e) Calculate the percentage of marks the student got out of 500.
Step by step video solution for Study the bar graph given below and answer the questions that follow (a) What information is depicted from the bar graph? (b) In which subject is the student very good? (c) Calculate the average marks of the student. (d) If 75 and above marks denote a distinction, then name the subjects in which the student got distinction. (e) Calculate the percentage of marks the student got out of 500. by Maths experts to help you in doubts & scoring excellent marks in Class 7 exams.
Updated on:21/07/2023Topper's Solved these Questions
- DATA HANDLINGBook:NCERT EXEMPLARChapter:DATA HANDLINGExercise:THINK AND DISCUSS
Explore 3 Videos
- DATA HANDLINGBook:NCERT EXEMPLARChapter:DATA HANDLINGExercise:EXERCISE(TRUE OR FALSE)
Explore 18 Videos
- COMPARING QUANTITIESBook:NCERT EXEMPLARChapter:COMPARING QUANTITIESExercise:THINK AND DISCUSS
Explore 24 Videos
- EXPONENTS AND POWERSBook:NCERT EXEMPLARChapter:EXPONENTS AND POWERSExercise:EXERCISE
Explore 136 Videos
Similar Questions
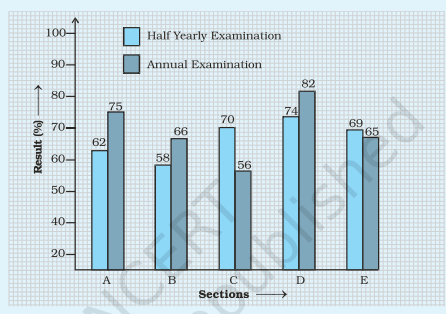
The double bar graph given below compares the class-averages in half yearly and annual examinations of 5 sections of Class VII.

Can you compare the ratio of difference of results of sections B and D ?
View SolutionTrue or False
If a die is thrown, the probability of getting a number greater than 6 is 1.
View SolutionDescribe how two ratios can form a proportion.
View Solution[(−3)2]3 is equal to
View SolutionThe value of |[a,a+d,a+2d] , [a+d,a+2d,a+3d] , [a+2d,a+3d,a+4d]|+|[b
View SolutionMatch the following Column A to Column B

View SolutionThe inequation represented by the graph given below is :
View SolutionThe inequation that best describes the graph given below is _________
View SolutionThe inequation that best describes the following graph is _________
View SolutionIn the given figure, PQRS is a parallelogram. A and B are the mid-point of ¯¯¯¯¯¯PQ and ¯¯¯¯¯SR respectively. If PS=BR, then the quadrilateral ADBC is a…………………… ,
ltimg src="https://d10lpgp6xz60nq.cloudfront.net/physics_images/PS_MATH_IX_C12_E05_020_Q01.png" width="80%"gt
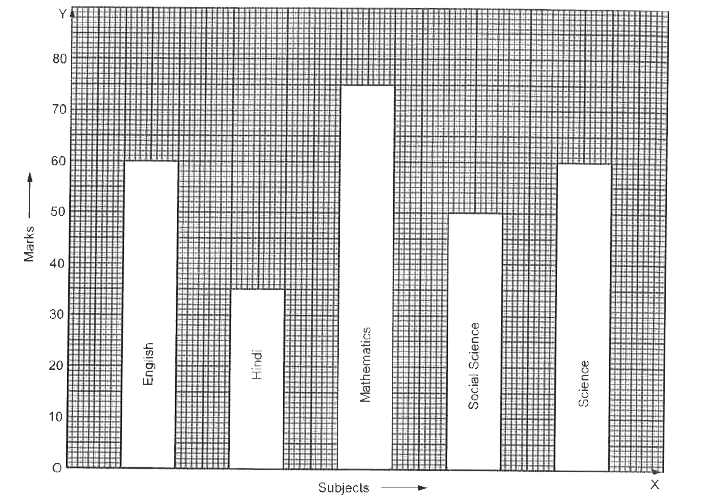
View SolutionLook at the bar graph given below
Read it carefully and answer the following questions
Q(i) What information does the bar graph give
(ii) In which subject is the student very good
(iii) In which subject is he poor
(iv) What is the average of his marks

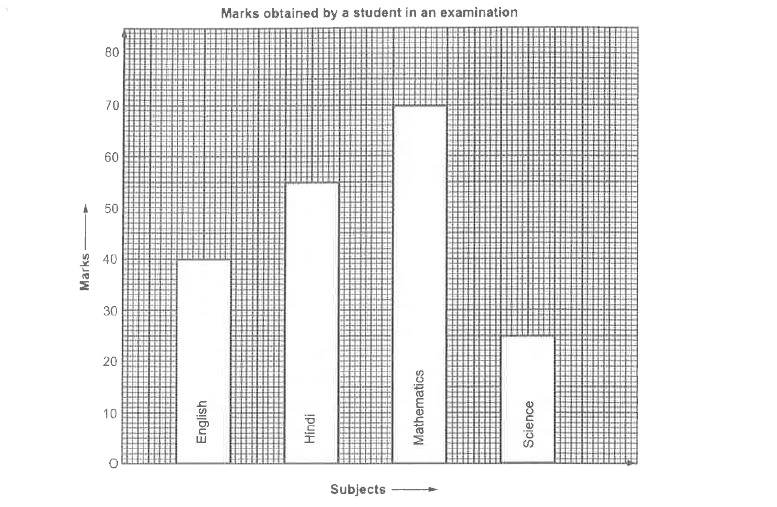
View SolutionLook at the bar graph given below.

Read if cerefully and answer the questions given below:
What information does the bar graph give ?
In which subject is the student poorest ?
In which subject is the student best ?
In which subjects did he get more than 40 marks ?
View SolutionFind correct features w.r.t. most advanced type of placentation. Br a. Parietal in Argemone. Br b. Basal in cereals. Br c. Axile in solanaceae. Br d. Unilocular ovary. Br e. Ovary with single ovule
View SolutionLook at the bar graph given below.
Read it care fully and answer the following questions.
(i) What information does the bar graph give?
(ii) In which subject is the student very good?
(iii) In which subject is the poor? (iv) What is the average of his marks?
View SolutionConsider the following modified structures in plants and select ontogenetically similar structures, br A. Phyllode in Acacia, br B. Thorn in Citrus, br C. Tendril in watermelon, br D. Cladode in Asparagus, br E. Spines in cacti
View Solution