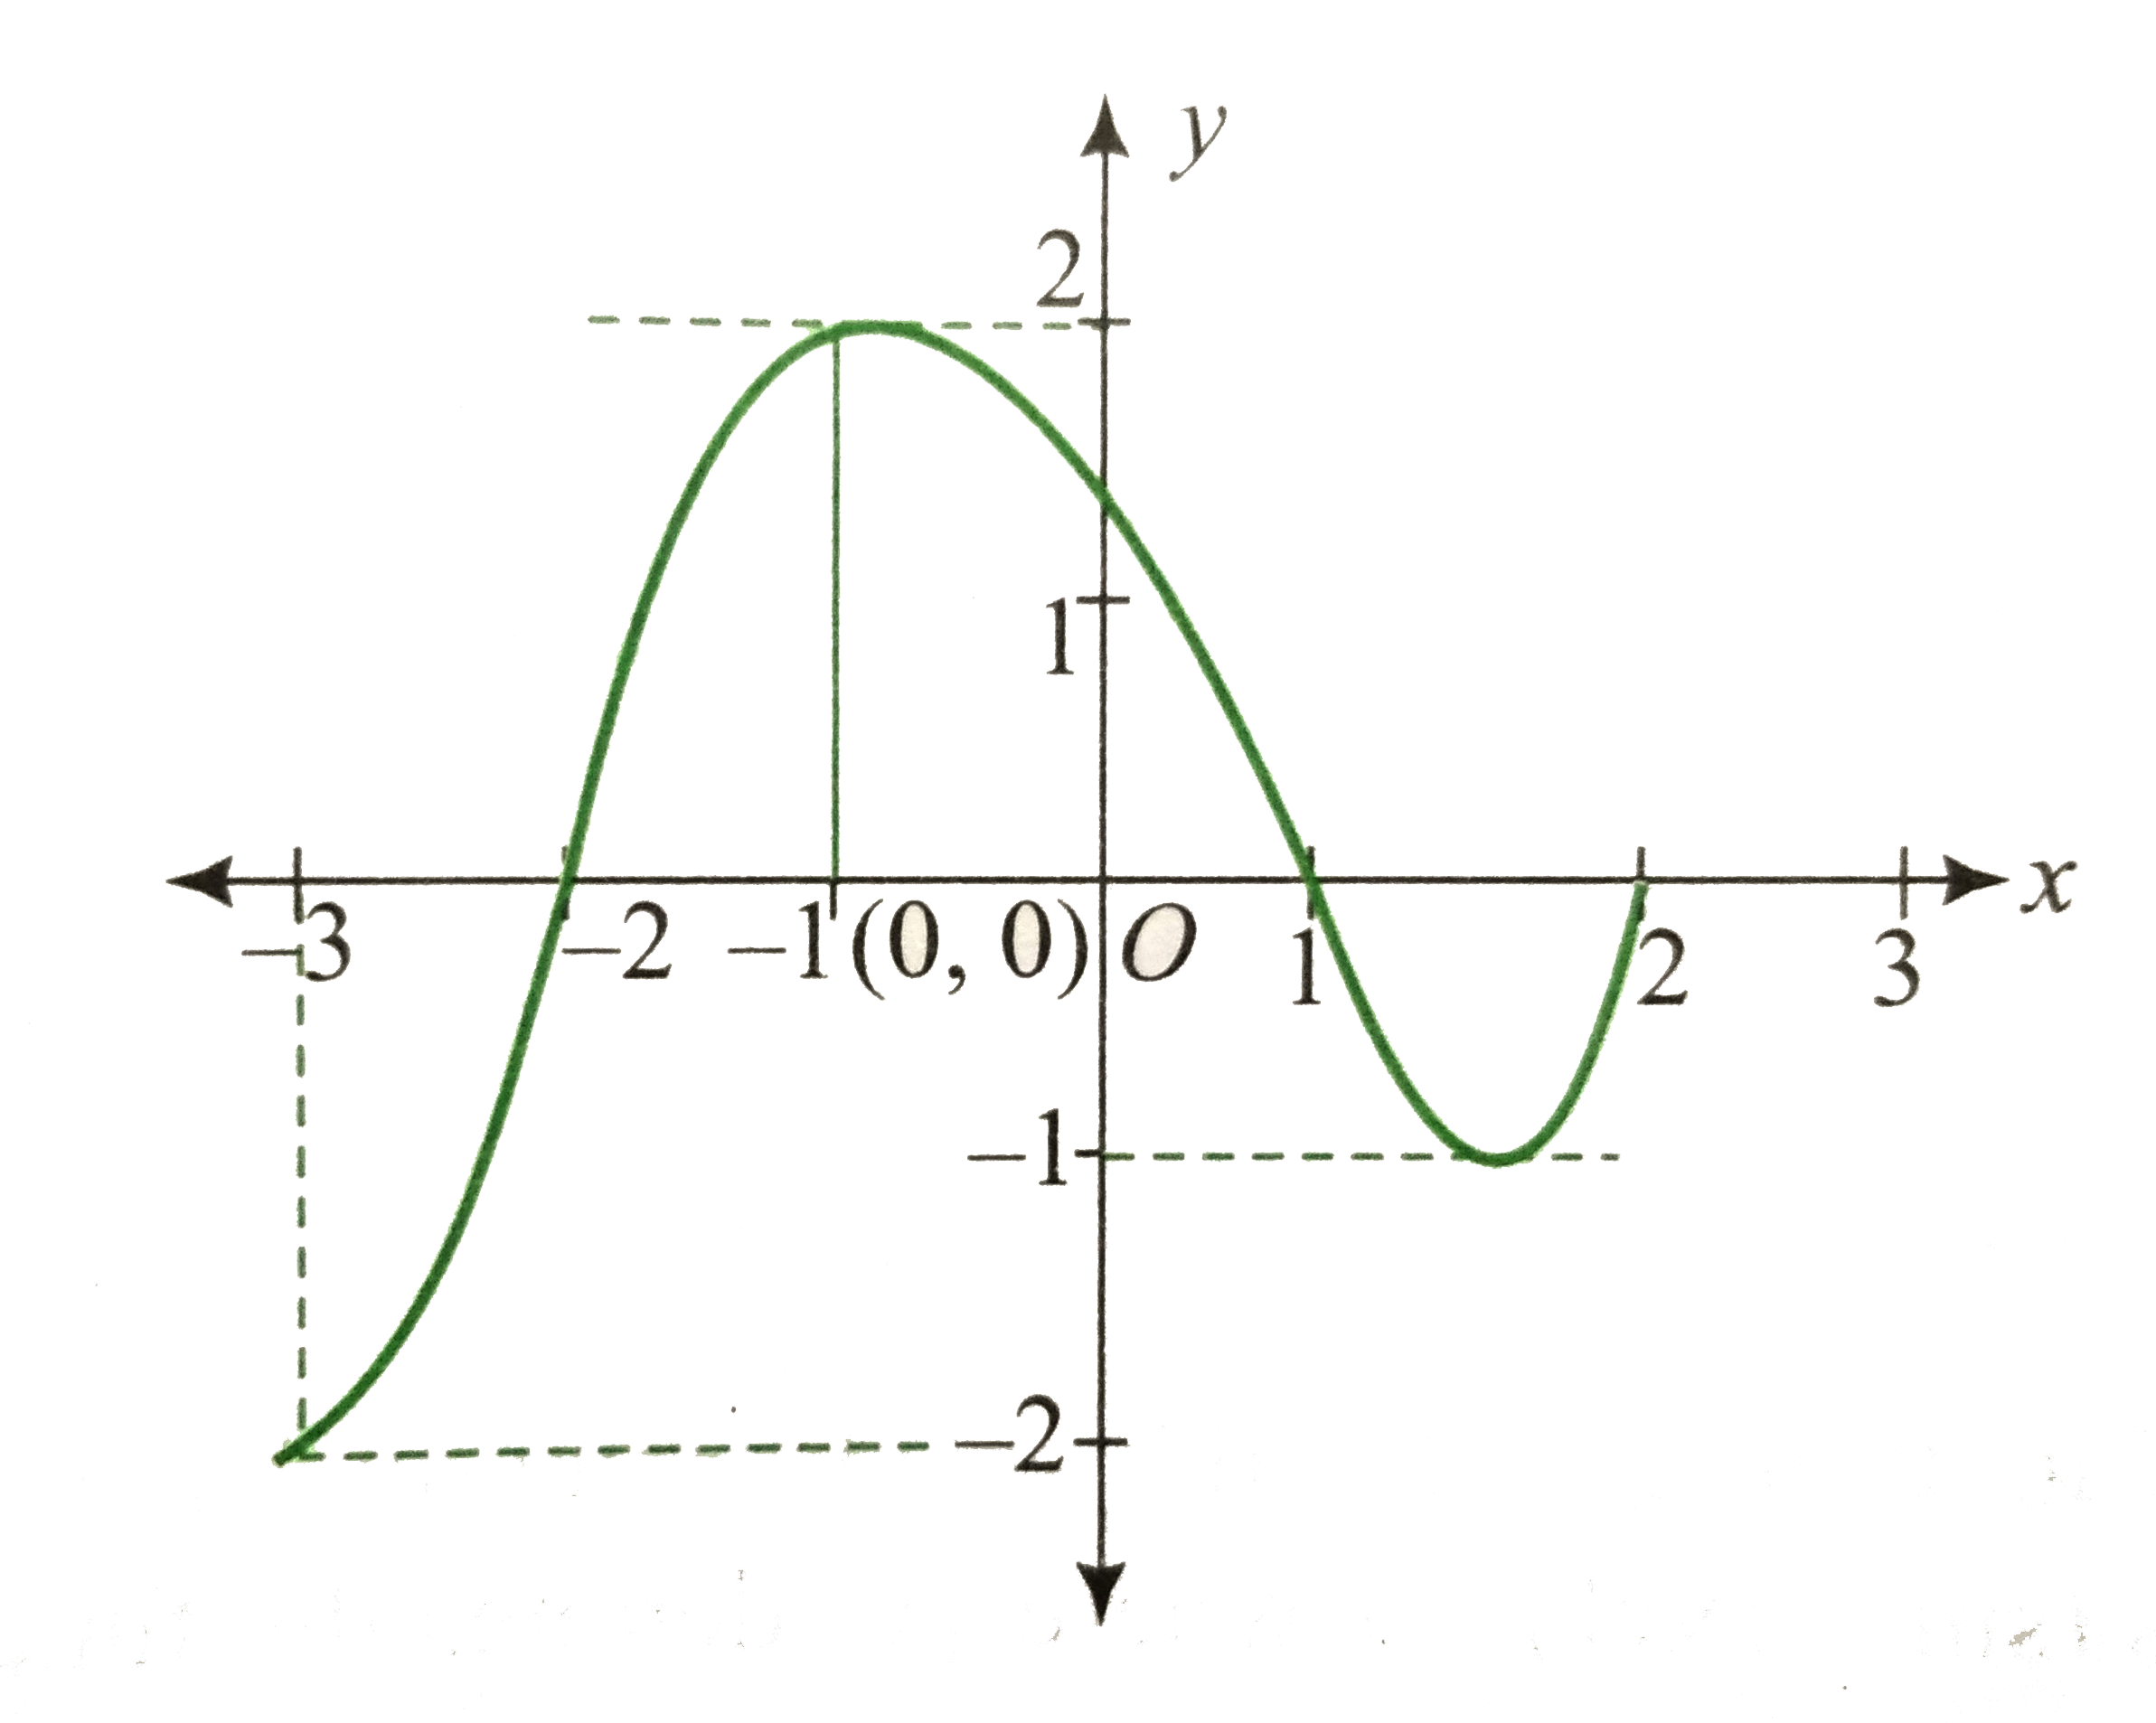
The figure illustrates the graph of the function y=f(x) defined in [-3, 2].

Identify the correct statement(s)?Solution in Bengali
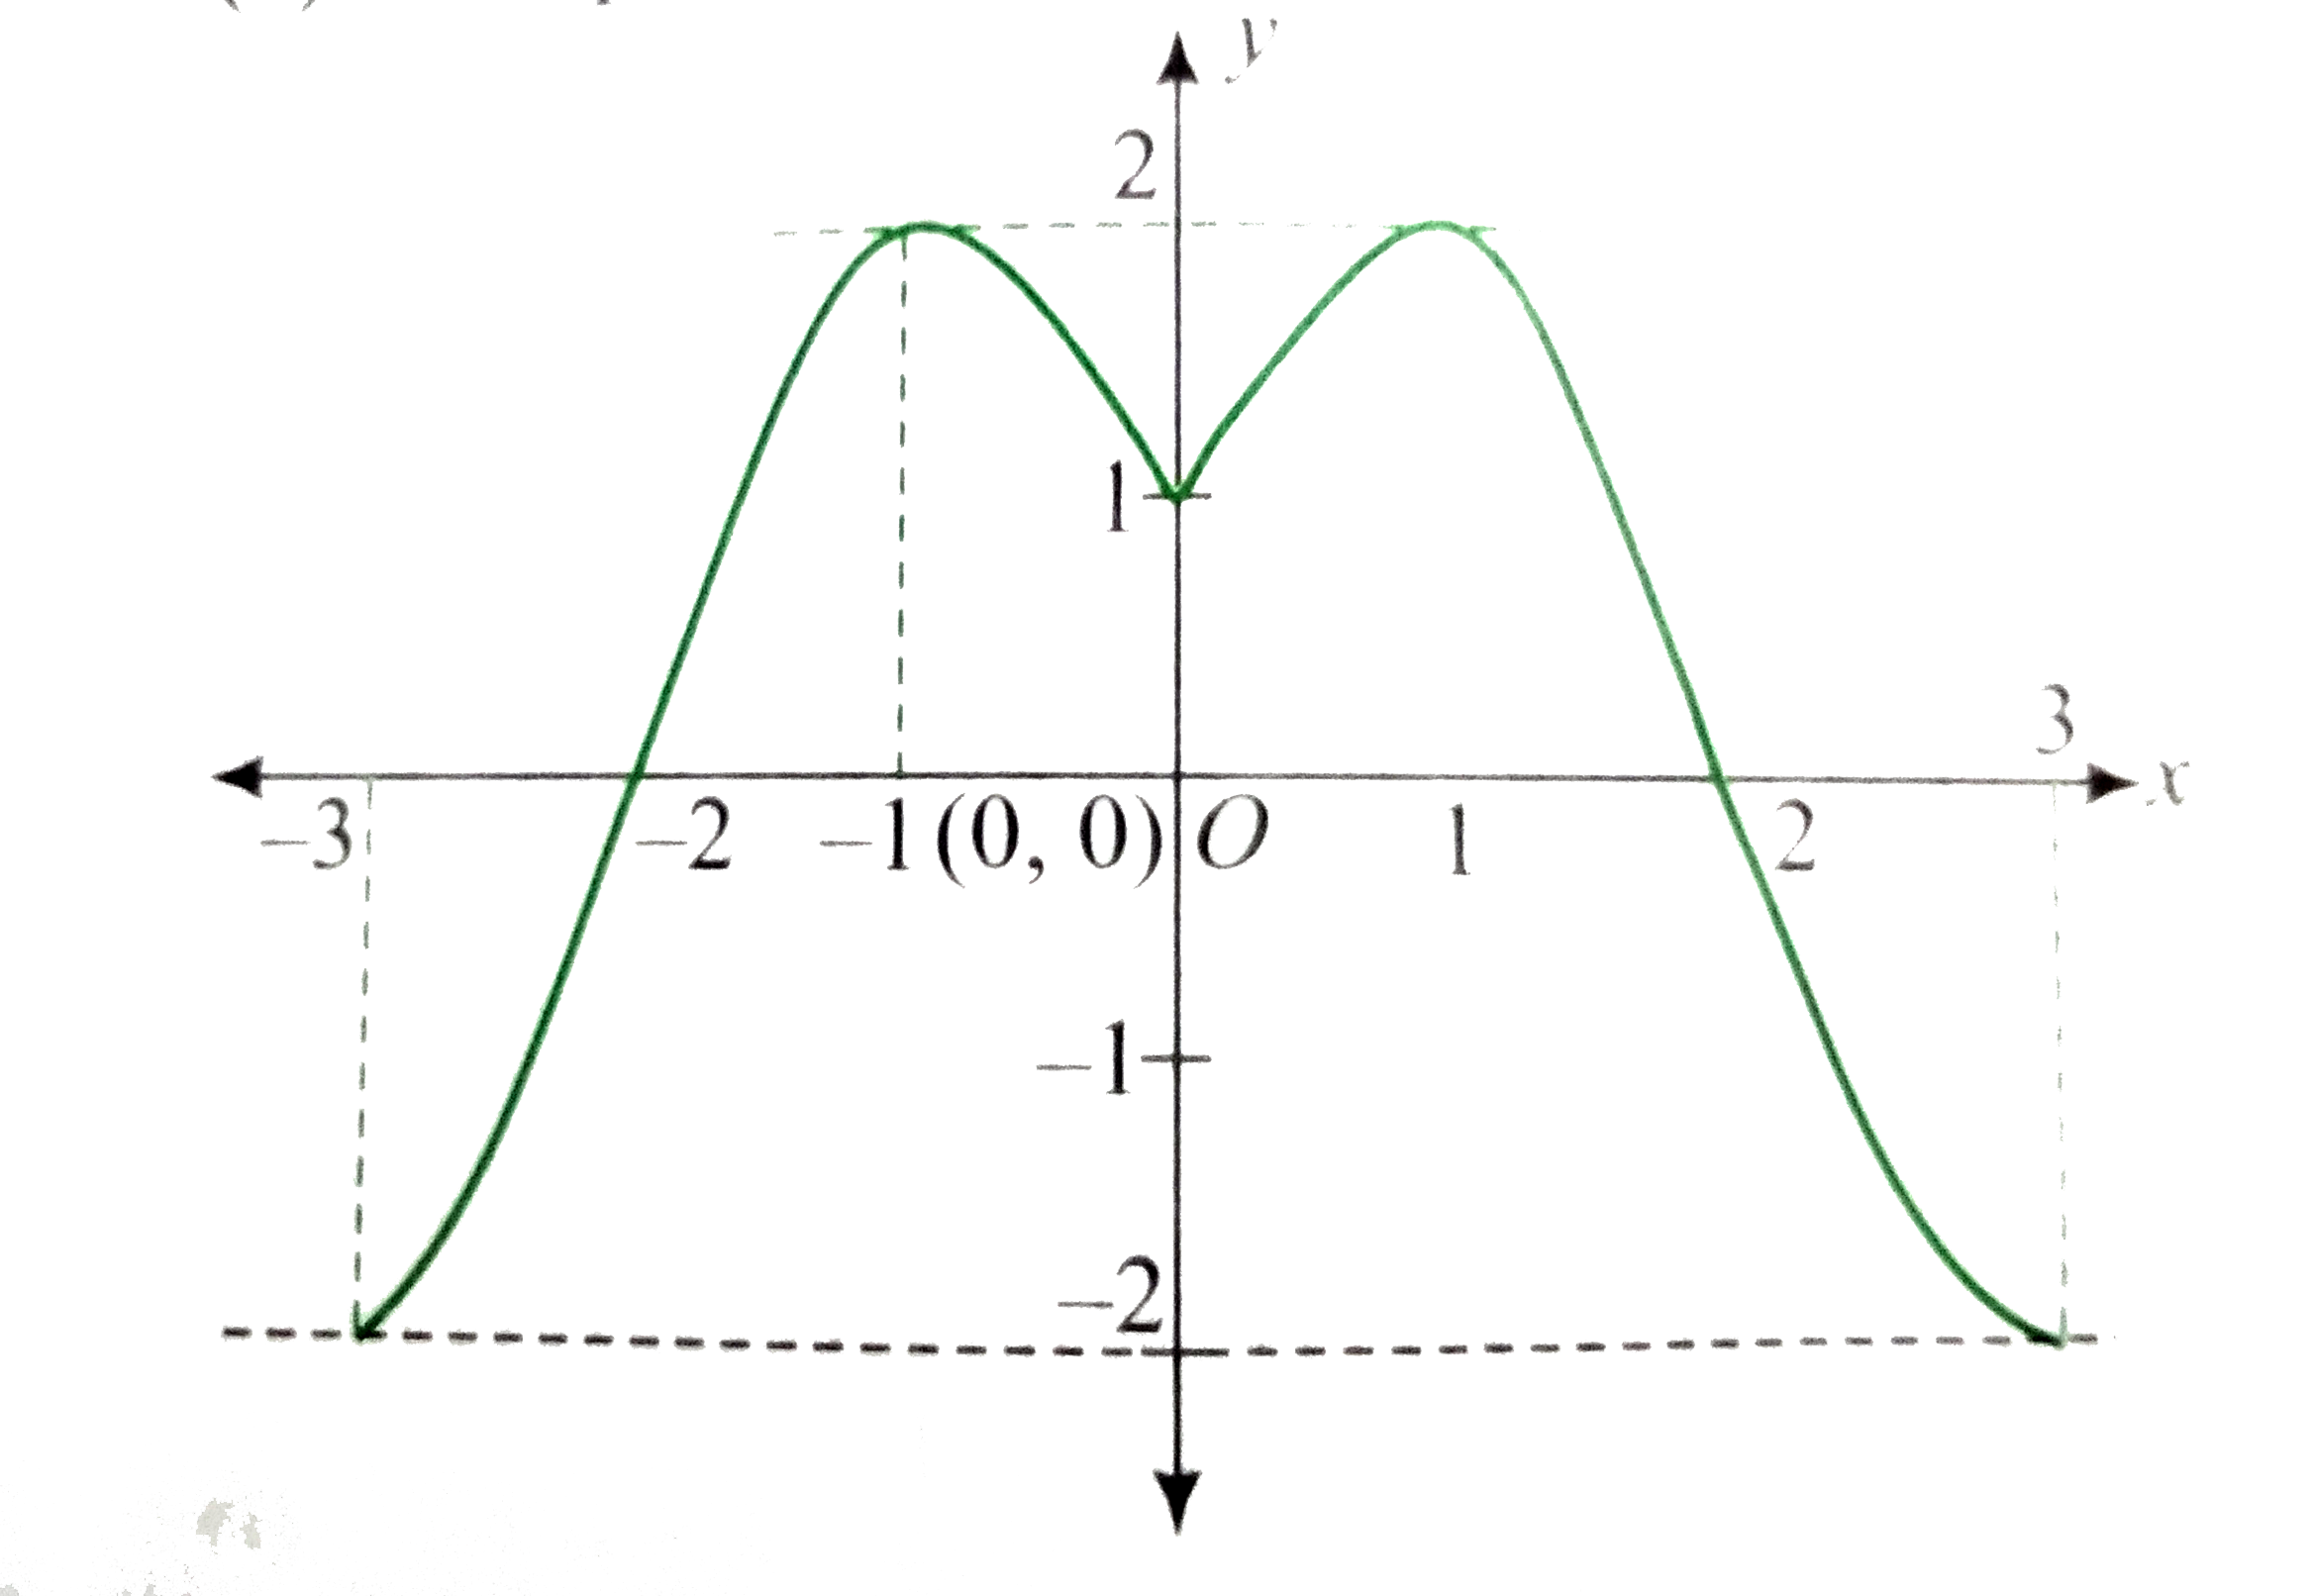
Range of y=f(−|x|) is [−2,2]
Domain of y=f(|x|) is [−2,2]
Domain of y=f|x|+1) is [−1,1]
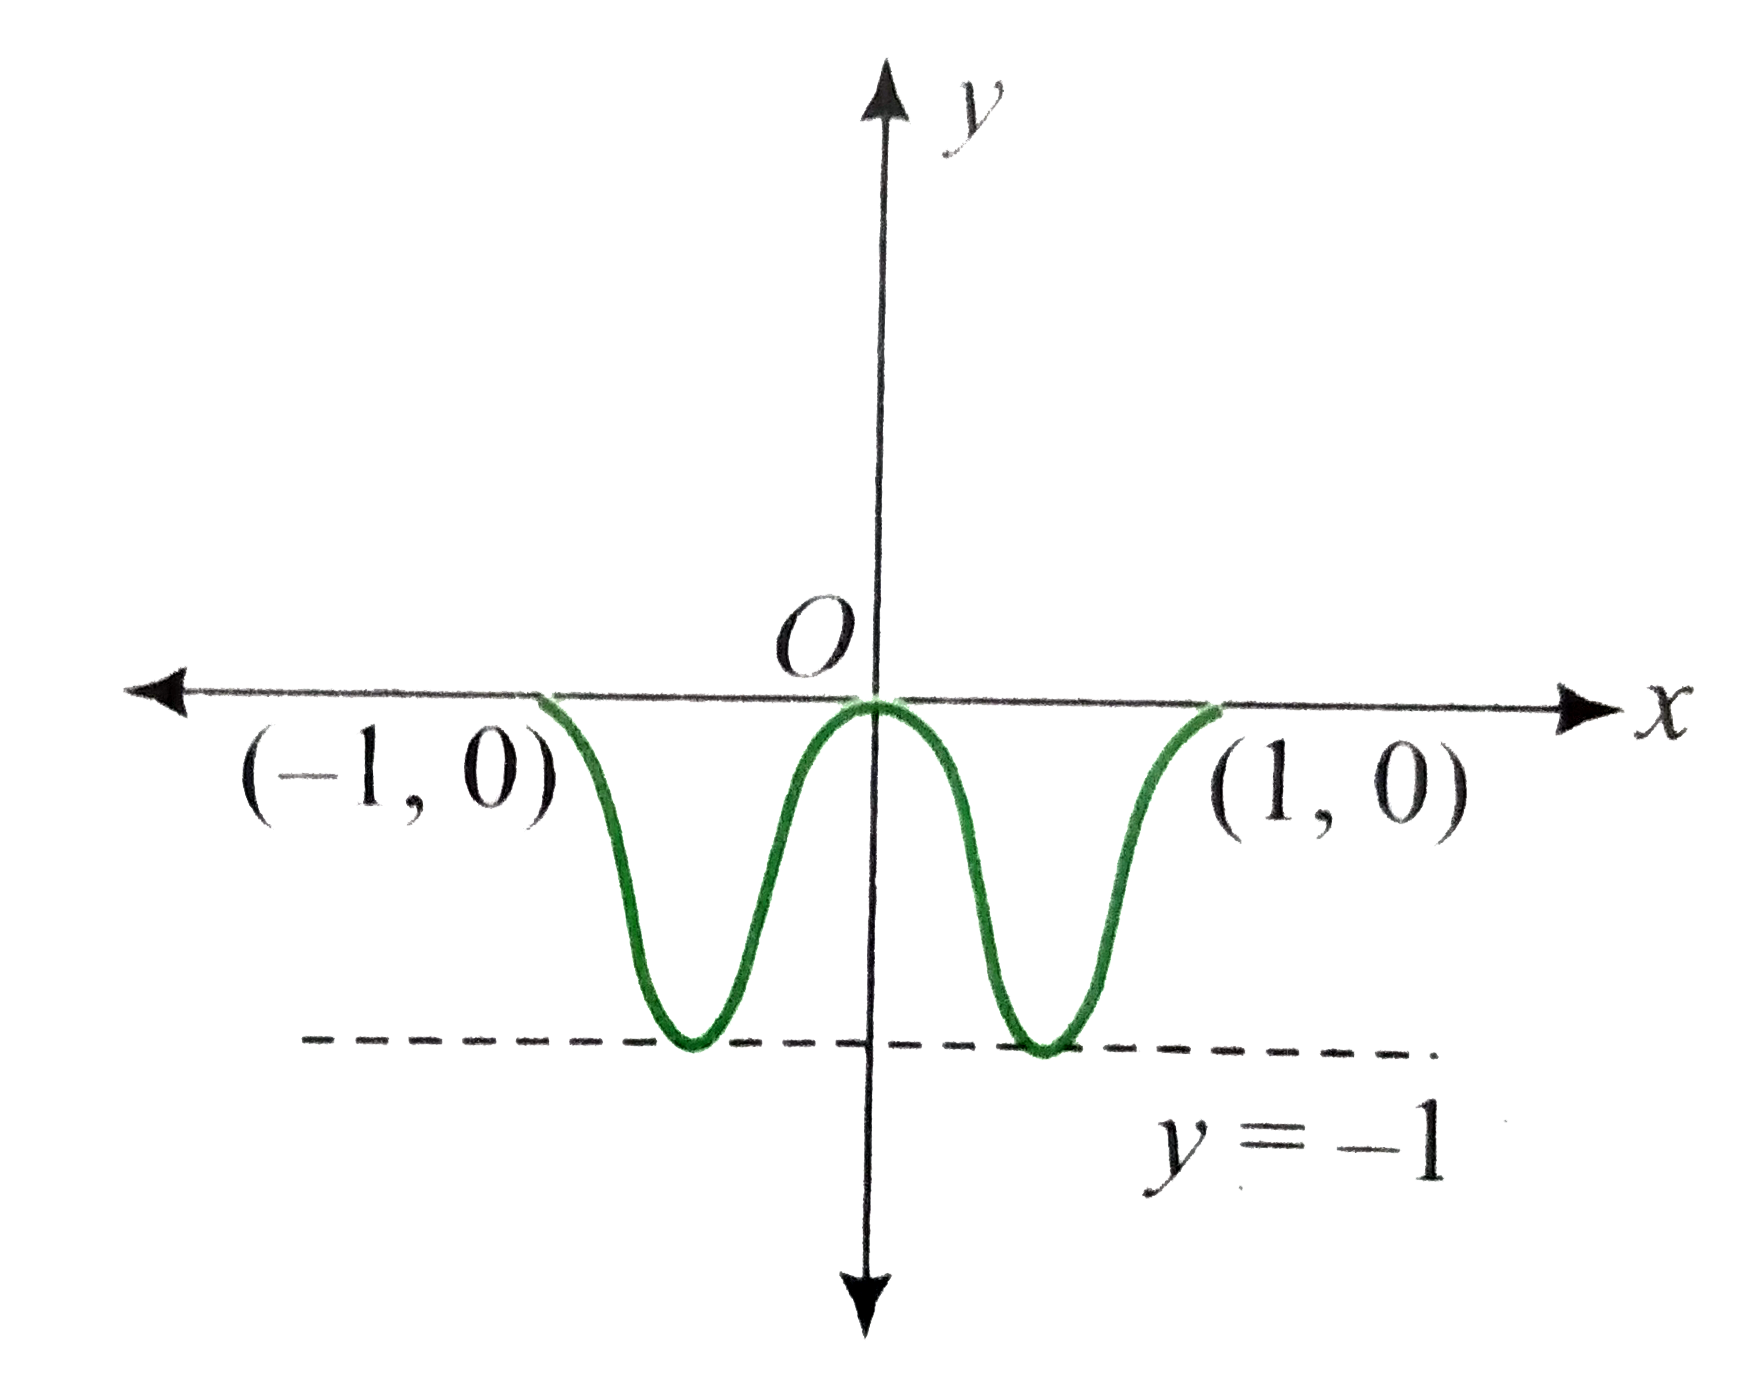
Range of y=f(|x|+1) is [−1,0]
The correct Answer is:A, B, C, D
(1) Graph of y=f(−|x|) is

∴ range is [-2, 2]
(2) Domain of y=f(|x|) is
−3≤|x|≤2
⇒−2≤x≤2
(3) Domain of y=f(|x|+1) is
−3≤|x|+1≤2
⇒−4≤|x|≤1
⇒x∈[−1,1]
(4) Graph of y=f(|x|+1) is

∴ Range is [-1, 0]
Topper's Solved these Questions
Similar Questions
Let ABCandABC' be two non-congruent triangles with sides AB=4,AC=AC′=2√2 and angle B=300 . The absolute value of the difference between the areas of these triangles is
View SolutionIf A,B and C are three sets such that A∩B=A∩CandA∪B=A∪C then
View SolutionIdentify the cell organelle 'A' :-
ltimg src="https://d10lpgp6xz60nq.cloudfront.net/physics_images/ALN_BIO_C10_E08_018_Q01.png" width="80%"gt
View SolutionHow many lines of symmetry does the above figure have ?
View SolutionWhich of the following are correct chain isomers of butane ? (i)
View SolutionDetermine the point of symmetry of a regular hexagon.
View SolutionDtermine the images of the following figure about the given line :
View SolutionMatch the following Column A to Column B

View SolutionMatch the following Column A to Column B

View SolutionMatch the following Column A to Column B

View SolutionFind the area of the figure given below.

View SolutionThe area of the shaded part in the figure given below is ______.

View SolutionThe inequation represented by the graph given below is :
View SolutionThe inequation that best describes the graph given below is _________
View SolutionThe inequation that best describes the following graph is _________
View SolutionWhich inequations represent the shaded region in the given figure
View Solution
