The following bar graph shows the rainfall at selected locations in certain months
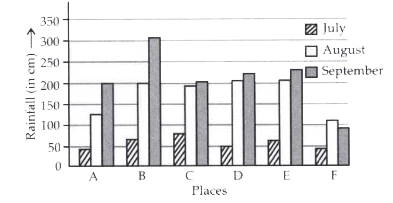
Which of the following statements is correct ?
July rainfall exceeds August rainfall by 100 cm in each location
September rainfall exceeds August rainfall by 50 cm in each location
July rainfall is lower August rainfall in each location
None of these
Step by step video solution for The following bar graph shows the rainfall at selected locations in certain months Which of the following statements is correct ? by Maths experts to help you in doubts & scoring excellent marks in Class 7 exams.
Updated on:21/07/2023Topper's Solved these Questions
- DATA HANDLINGBook:MTG IIT JEE FOUNDATIONChapter:DATA HANDLINGExercise:Exercise (Level - 2) M.C.Q
Explore 15 Videos
- DATA HANDLINGBook:MTG IIT JEE FOUNDATIONChapter:DATA HANDLINGExercise:Exercise (Level - 2) Match the Following
Explore 2 Videos
- DATA HANDLINGBook:MTG IIT JEE FOUNDATIONChapter:DATA HANDLINGExercise:NCERT Section (Exercise - 3 .4 )
Explore 8 Videos
- CONGRUENCE OF TRIANGLES Book:MTG IIT JEE FOUNDATIONChapter:CONGRUENCE OF TRIANGLES Exercise:Olympiad/HOTS Corner
Explore 10 Videos
- EXPONENTS AND POWERSBook:MTG IIT JEE FOUNDATIONChapter:EXPONENTS AND POWERSExercise:OLYMPIAD/HOTS CORNER
Explore 15 Videos
Similar Questions
Knowledge Check
Which of the following graphs is/are correct.
A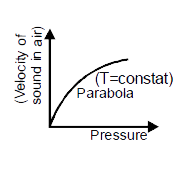 B
B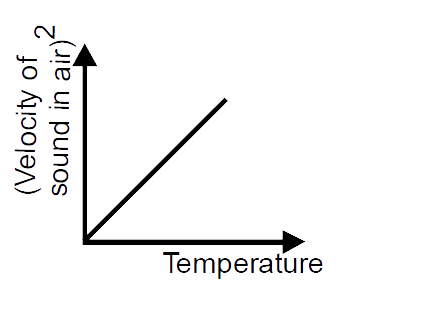 C
C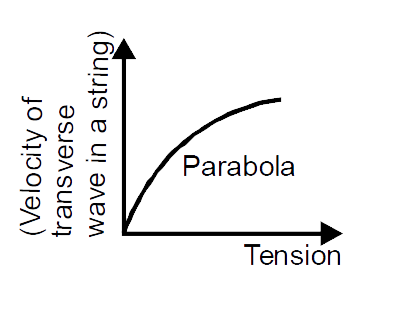 D
D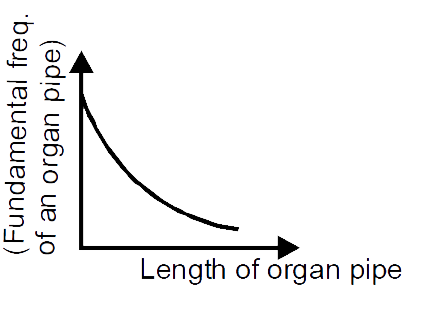
Which of the following graph is correct
A_2019_CBT6_E01_019_O01.png) B
B_2019_CBT6_E01_019_O02.png) C
C_2019_CBT6_E01_019_O03.png) D
D_2019_CBT6_E01_019_O04.png)
Which of the following sequences is correct for rainfall?
ASlow ascent of air slow condensation - heavy downpourBRapid ascent of air large raindrops heavy downpourCPressure decreased air compressed heavy downpourDDescent of air air warmed-heavy downpour
Which of the following graph is correct?
View SolutionFor the circuit shows in Fig which of the following statements is //are correct?

View SolutionWhich of the following statements is not correct for a bar graph ?
View SolutionWhich of the following statement is correct w.r.t. the following graph?
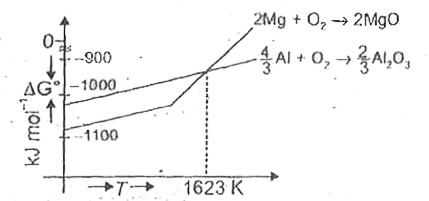
View SolutionFigure shows velocity time graph of a particle moving in straight line. Which of the following statement(s) is / are CORRECT:−
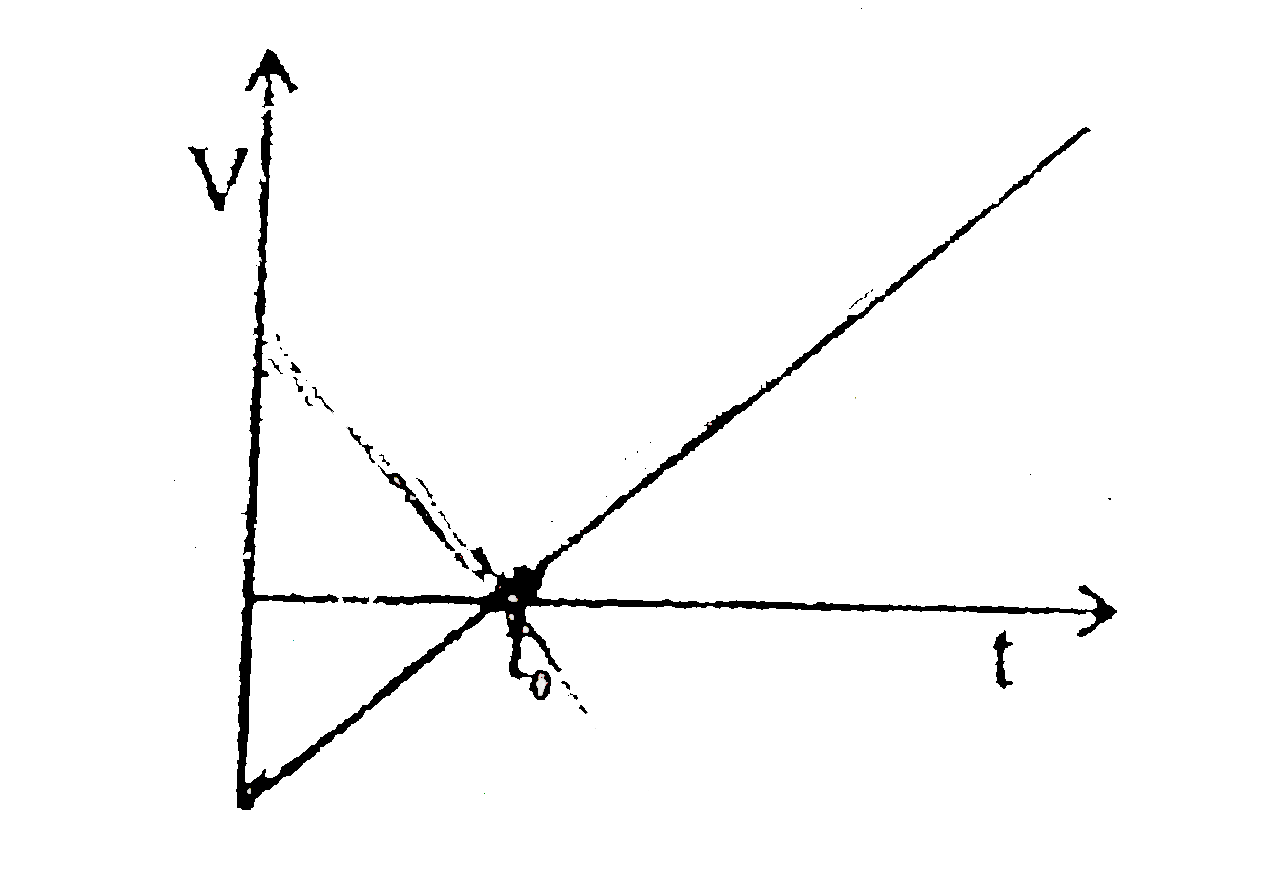
View Solution
