The following frequency distribution shows the distance (in metres) thrown by 68 studentsin a Javelin throw competition.Distance (in m) 0-10,10-20 20-30 30-40 40-50 50-60 60-70 Number of students 4 5 13 20 14 8 4
The correct Answer is:36 m
Step by step video & text solution for The following frequency distribution shows the distance (in metres) thrown by 68 studentsin a Javelin throw competition.Distance (in m) 0-10,10-20 20-30 30-40 40-50 50-60 60-70 Number of students 4 5 13 20 14 8 4 by Maths experts to help you in doubts & scoring excellent marks in Class 10 exams.
Updated on:21/07/2023Topper's Solved these Questions
- NEW TYPOLOGIES INTRODUCED BY CBSE FOR BOARD 2021-22 EXAM BOOK - OSWAL PUBLICATIONCHAPTER - NEW TYPOLOGIES INTRODUCED BY CBSE FOR BOARD 2021-22 EXAM EXERCISE - UNIT-VII STATISTICS AND PROBABILITY (STATISTICS) (SELF ASSESSMENT)
2 Videos
- NEW TYPOLOGIES INTRODUCED BY CBSE FOR BOARD 2021-22 EXAM BOOK - OSWAL PUBLICATIONCHAPTER - NEW TYPOLOGIES INTRODUCED BY CBSE FOR BOARD 2021-22 EXAM EXERCISE - UNIT-VI MENSURATION (CHAPTER 13 - SURFACE AREAS AND VOLUMES) (SELF ASSESSMENT)
4 Videos
- MAT STAGE I 2019-2020BOOK - OSWAL PUBLICATIONCHAPTER - MAT STAGE I 2019-2020EXERCISE - QUESTION PART
100 Videos
- NTSE 2019 -20BOOK - OSWAL PUBLICATIONCHAPTER - NTSE 2019 -20EXERCISE - Probability Stage -2
1 Video
Similar Questions
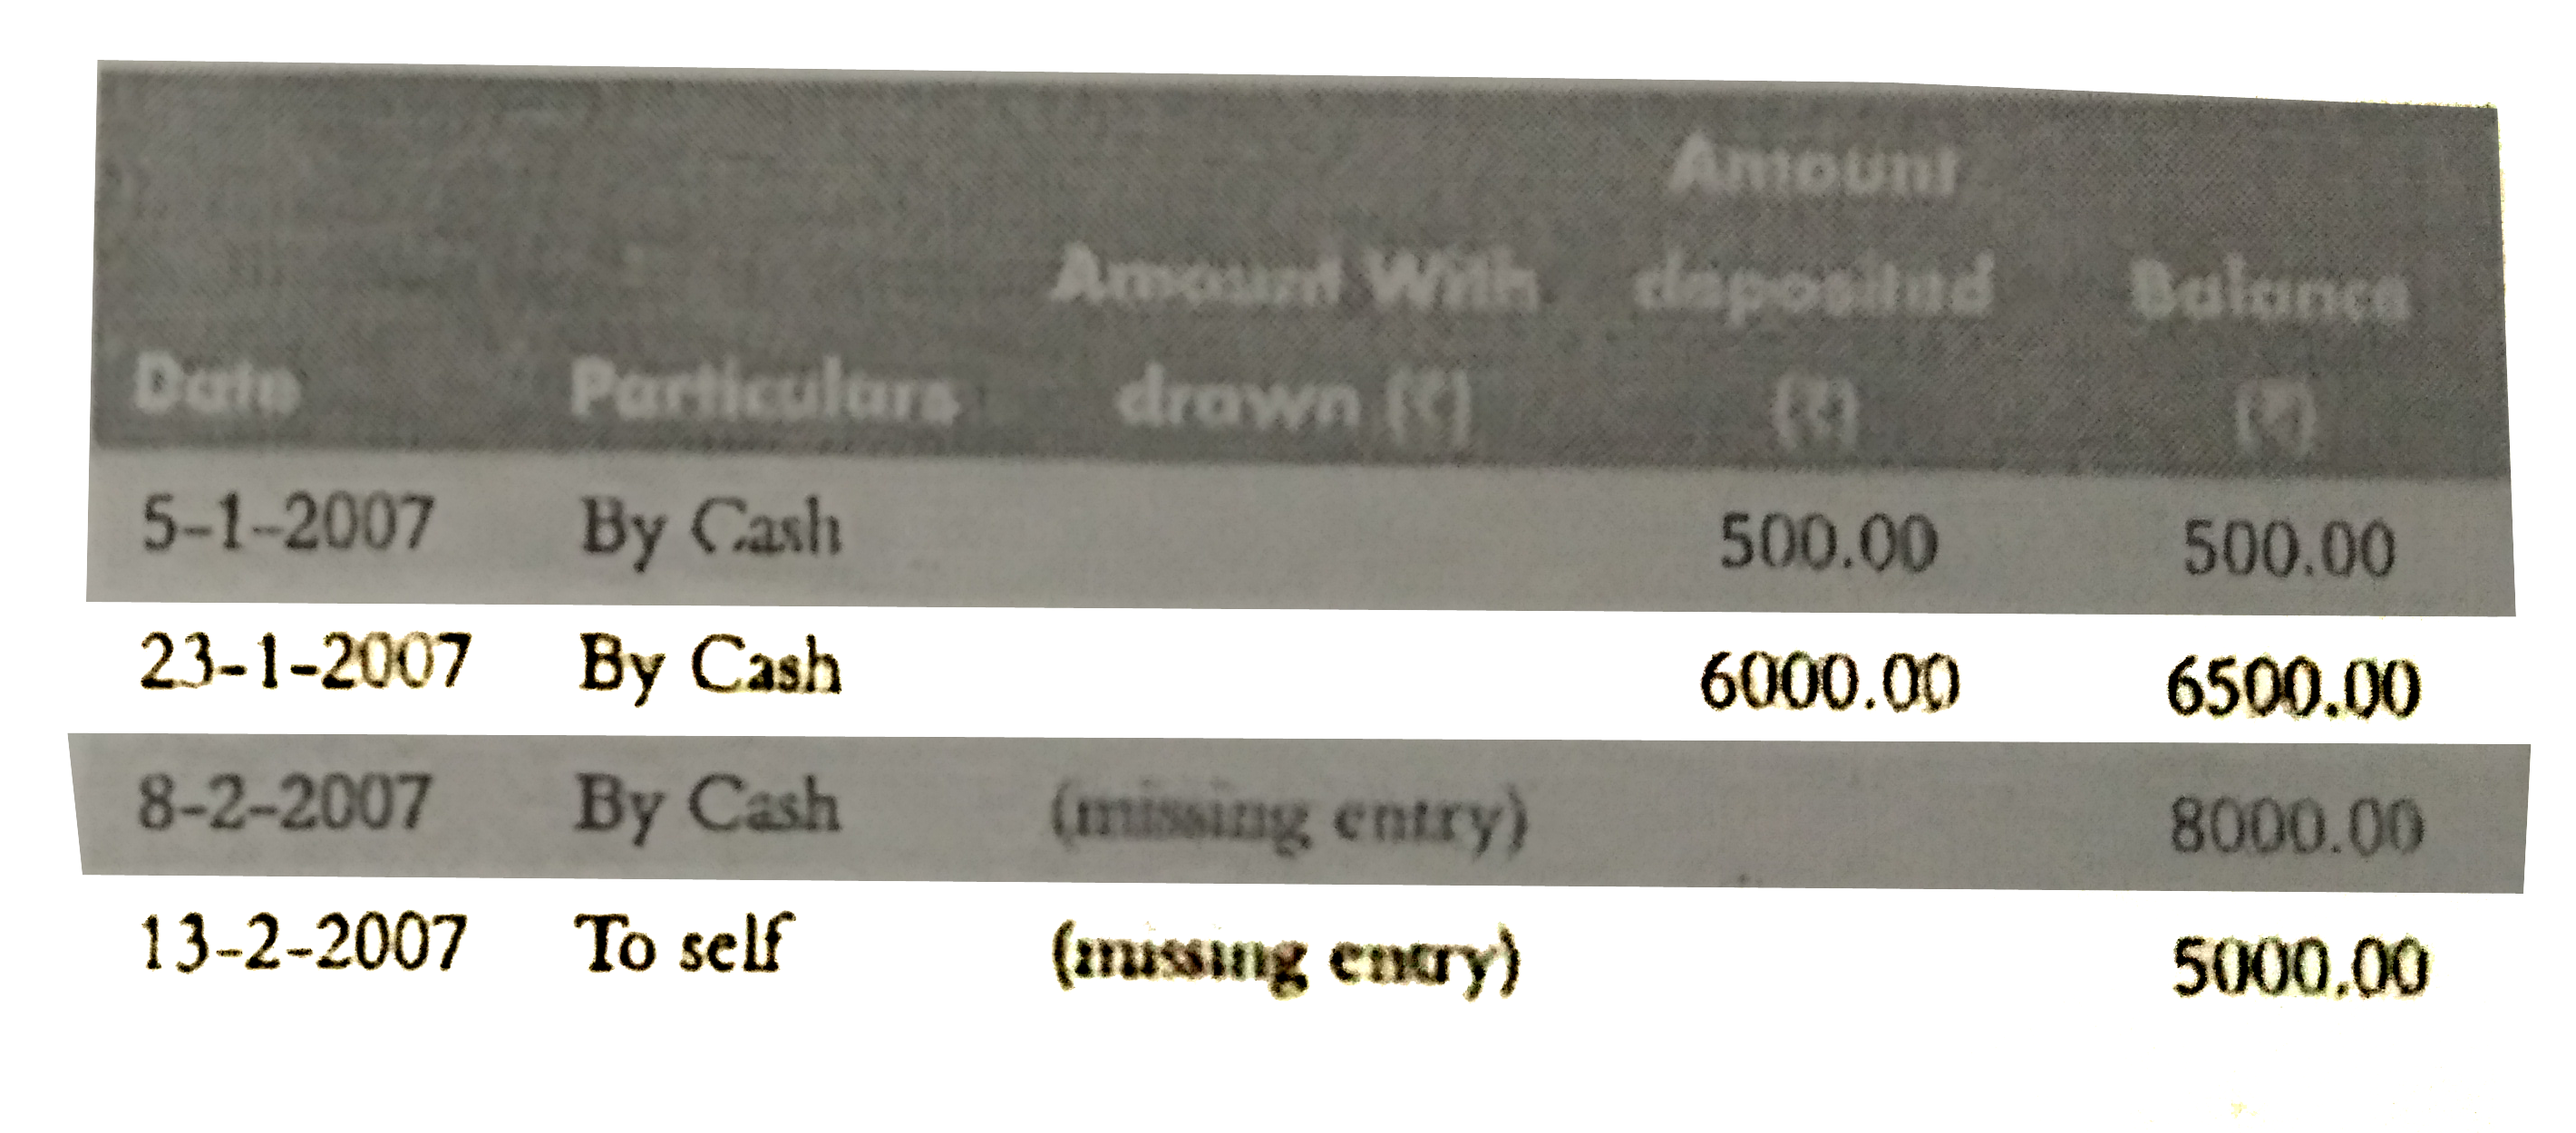
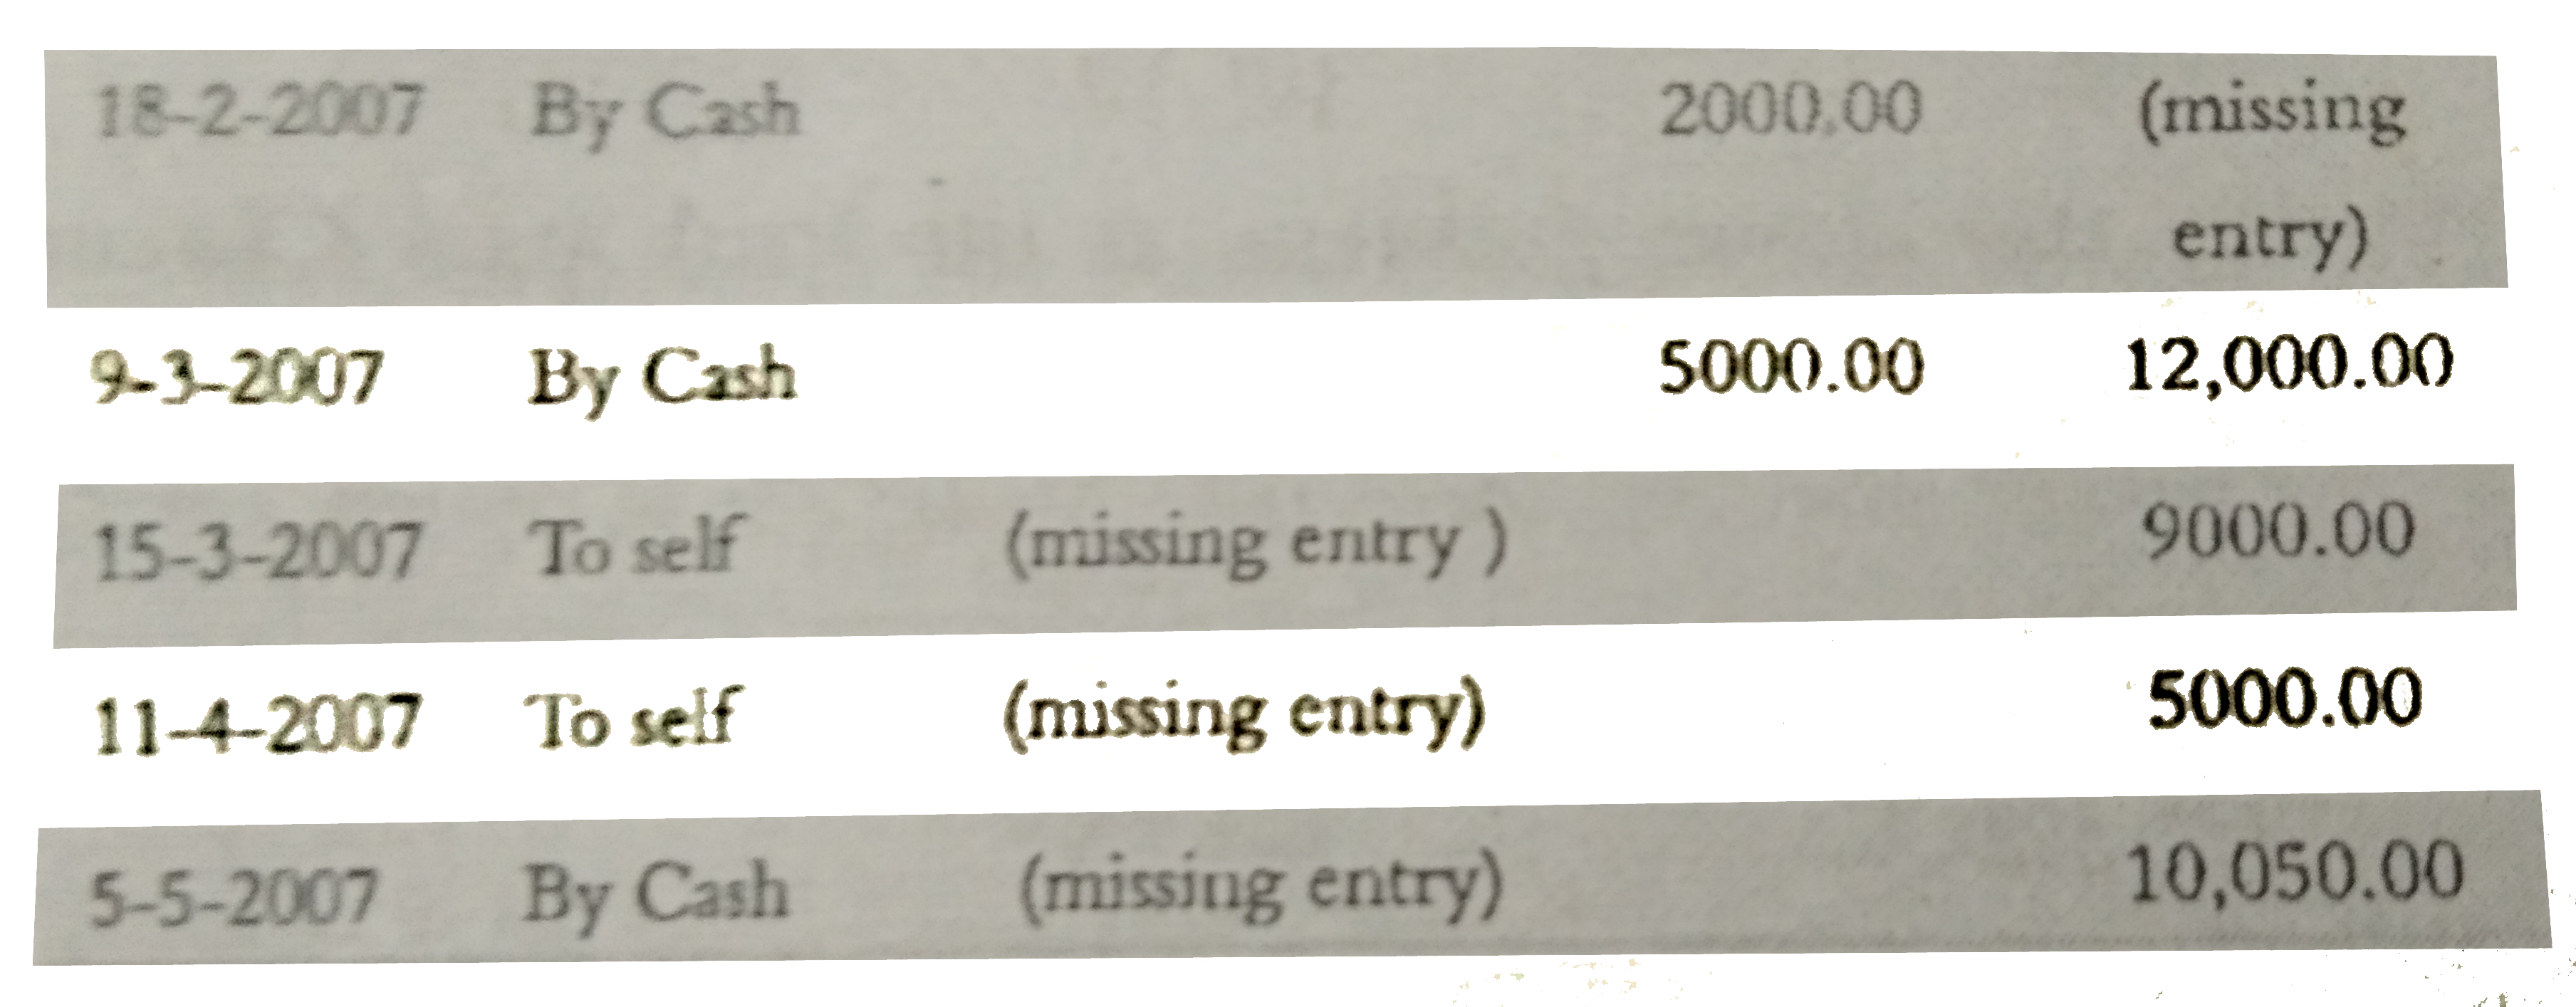
A page from Richa's pass book is given below. Answer the following question by finding the missing entries. She closes her account on 30−6−2007.


Find the amount on which she will receive interest on closing her account.
View SolutionIf the areas of circular bases of a frustum of a cone are 4 cm2 and 9 cm2 respectively and the height of the frustum is 12 cm. What is the volume of the frustum?
View SolutionIf a3=b5=c7, then value of a+b+cb will be:
View SolutionIf two dice are thrown together . Then , the probability that the sum of the numbers appearing on them is a prime number, is
View SolutionFind the mean deviation about median for the following data

View SolutionFind the median of the following data: class : 0−10,equency:5, 10−20,3, 20−30,4, 30−40,3, 40−50,3,50-60 , 4,60-70 , 7, 70-80 , 9,80-90 , 7,90-100 , 8,
View SolutionThe following frequency distribution shows the distance (in metres) thrown by 68 studentsin a Javelin throw competition.Distance (in m) 0-10,10-20 20-30 30-40 40-50 50-60 60-70 Number of students 4 5 13 20 14 8 4
View SolutionWrite the median class for the following frequency distribution: Class-interval: 0-10 10-20 20-30 30-40 40-50 50-60 60-70 70-80 Frequency: 5 8 7 12 28 20 10 10
View SolutionWrite the median class of the following distribution: Classes: 0-10 10-20 20-30 30-40 40-50 50-60 60-70 Frequency: 4 4 8 10 12 8 4
View SolutionCalculate mean, variance and standard deviation of the following frequency distribution:
Class Frequency
1−10 11
10−20 29
20−30 18
30−40 4
40−50 5
50−60 3
View SolutionThe following table gives the marks scored by 100 students in an entrance examination.

View Solutionनिम्न प्रेक्षण 18 छात्रों के गणित की परीक्षा में प्राप्तांकों को दर्शाते है, इनका माध्य ज्ञात कीजिए -
45, 40, 50, 40, 60, 40, 50, 50, 70, 30, 20, 70, 50, 45, 30, 20, 70, 70
View Solutionनिम्नलिखित सारणी का बहुलक ज्ञात कीजिए।
वर्ग0−1010−2020−3030−4040−5050−6060−70 आवृत्ति 8152040301412
View SolutionCalculate the mean and standard deviation for the following distribution: Marks:, 20-30, 30-40, 40-50, 50-60, 60-70, 70-80, 80-90 No. of students:, 3, 6, 13, 15, 14, 5, 4
View SolutionThe following table gives the marks scored by 100 students in an entrance examination. Marks: 0-10 10-20 20-30 30-40 40-50 50-60 60-70 70-80 No. of Students (Frequency): 4 10 16 22 20 18 8 2 Represent this data in the form of a histogram.
View SolutionFind the median of the following data: class : 0−10,equency:5, 10−20,3, 20−30,4, 30−40,3, 40−50,3,50-60 , 4,60-70 , 7, 70-80 , 9,80-90 , 7,90-100 , 8,
View Solution
