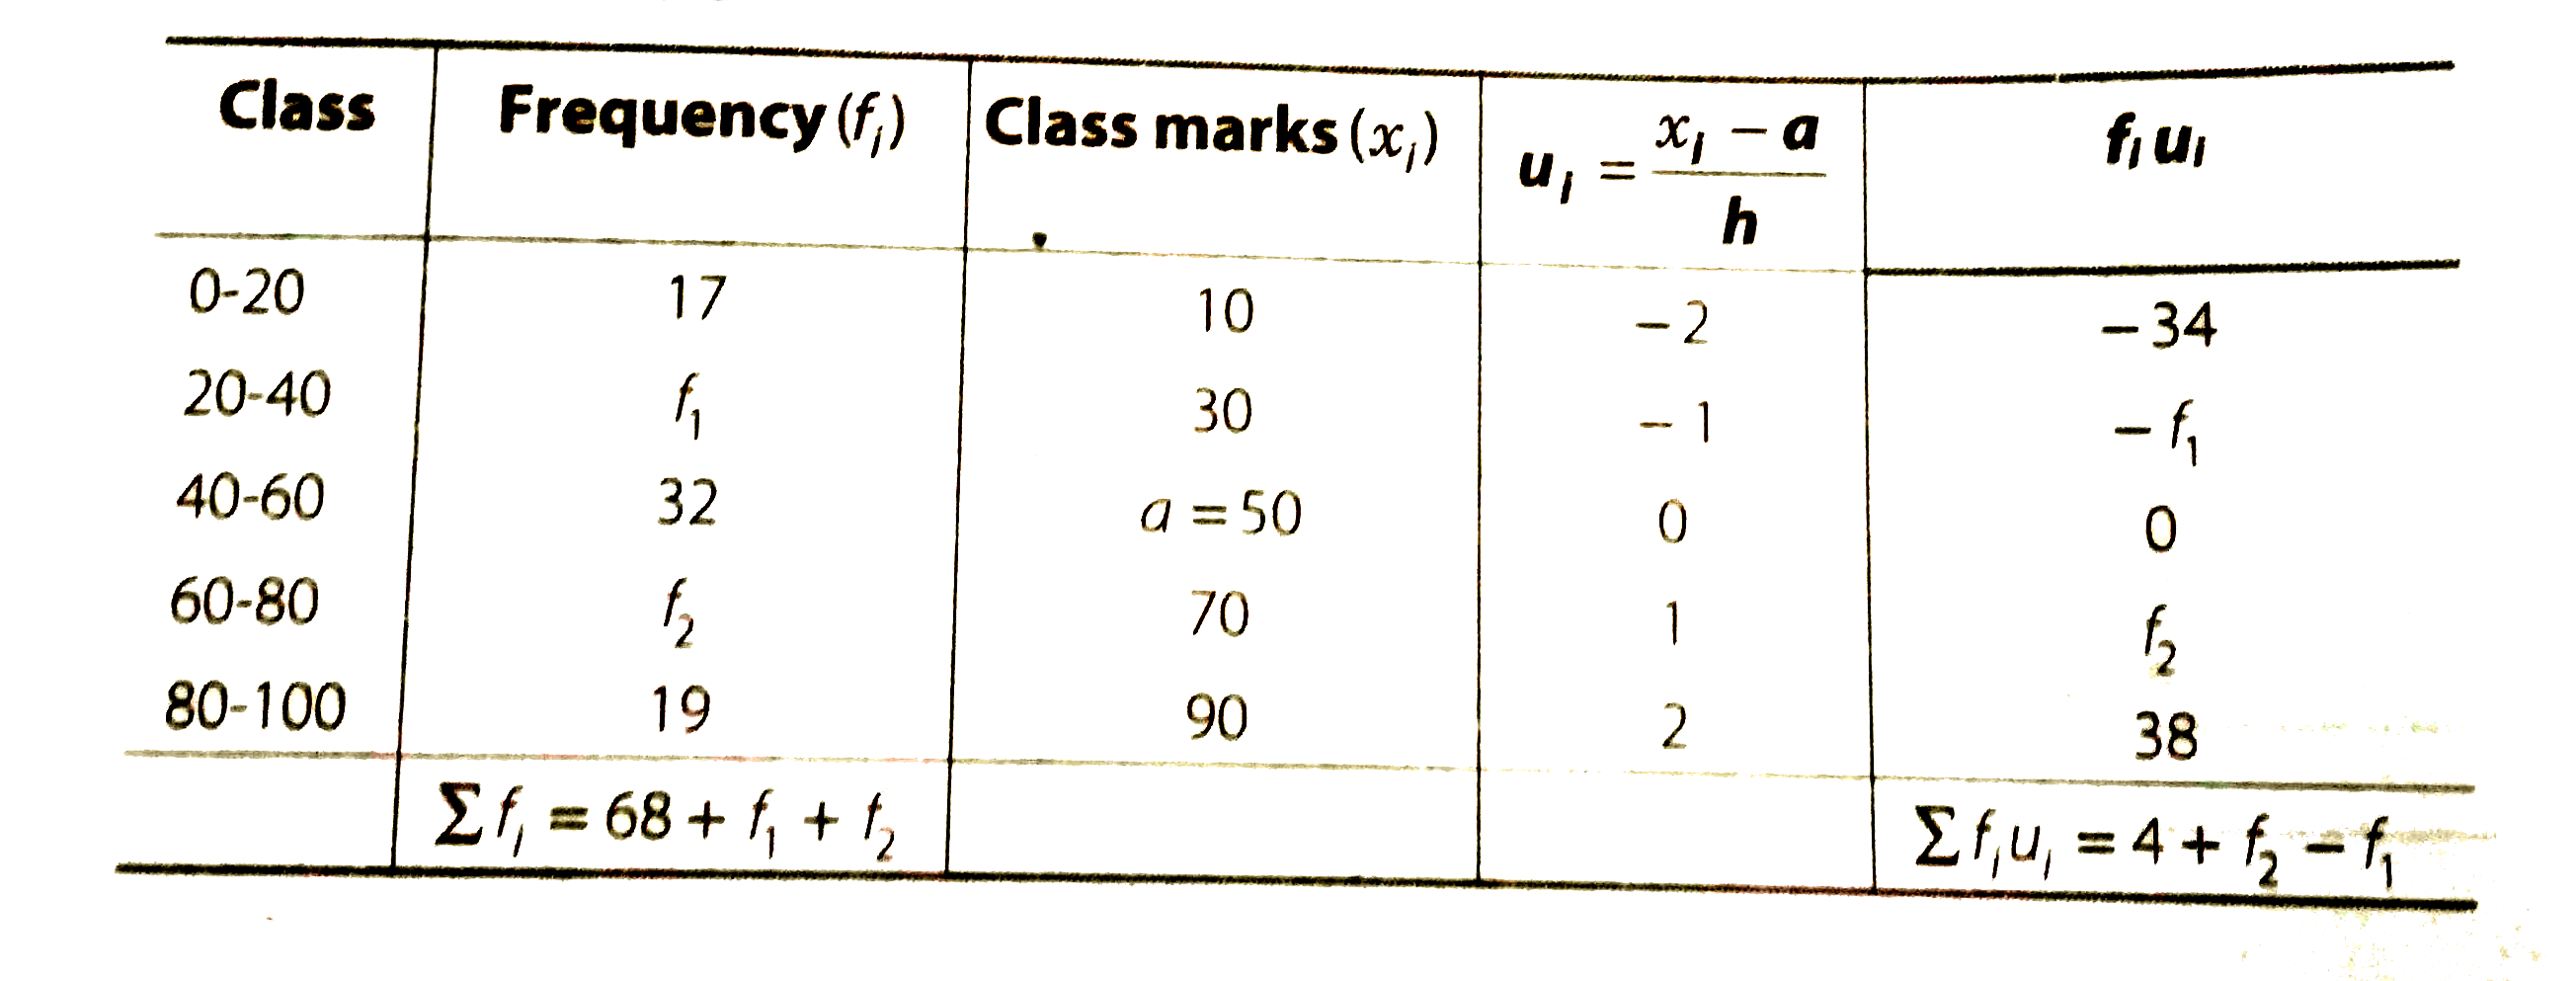
The mean of the following distribution is 50 but the frequency f1andf2 in classes 20-40 and 60-80, resepectively are not known. Find these frequencies, if the sum of all the fequencies is 120

First we calculate the class mark of given data

Given data sum of all frequencies =120
⇒∑fi=68+f1+f2=120
⇒f1+f2=52
Here, assumed mean a=50
and (class width)h=20
By step deviation method Mean=a+∑fiui∑fi×h
⇒50=50+4+f2−f1120×20
⇒4+f2−f1=0
⇒−f2+f1=4
On adding Eq. (i) and (ii), we get 2f_(1)=56
⇒f_(1)=24<br>f_(2)=24<br>Hence,f_(1)=28 and f_(2)=24
Topper's Solved these Questions
- STATISTICS AND PROBABILITYBOOK - NCERT EXEMPLAR ENGLISHCHAPTER - STATISTICS AND PROBABILITYEXERCISE - SHORT ANSWERS QUESTIONS
42 Videos
- REAL NUMBERSBOOK - NCERT EXEMPLAR ENGLISHCHAPTER - REAL NUMBERSEXERCISE - LONG ANSWER TYPE QUESTIONS
5 Videos
- SURFACE AREAS AND VOLUMESBOOK - NCERT EXEMPLAR ENGLISHCHAPTER - SURFACE AREAS AND VOLUMESEXERCISE - LONG ANSWER TYPE QUESTIONS
20 Videos
Similar Questions
Find the mean of the distibution

View SolutionShow that the cube of a positive integer of the form 6q+r,q is an integer and r=0,1,2,3,4,5 is also of the form 6m+r
View SolutionA hemisphere of lead of radius 8cm is cast into a right circular cone of base radius 6cm. Determine the height of the cone, correct to two places of decimal.
View SolutionThe mean of the following distribution is 50 but the frequency f1andf2 in classes 20-40 and 60-80, resepectively are not known. Find these frequencies, if the sum of all the fequencies is 120

View SolutionWhich of the following are correct chain isomers of butane ? (i)
View SolutionDetermine the point of symmetry of a regular hexagon.
View SolutionDtermine the images of the following figure about the given line :
View SolutionMatch the following Column A to Column B

View SolutionMatch the following Column A to Column B

View SolutionMatch the following Column A to Column B

View SolutionFind the perimeter of the figure given below.

View SolutionFind the area of the figure given below.

View SolutionThe inequation represented by the graph given below is :
View SolutionThe inequation that best describes the graph given below is _________
View SolutionThe inequation that best describes the following graph is _________
View Solution
