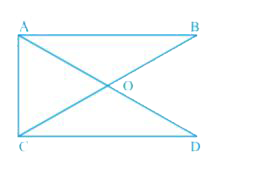
The number of triangles in Fig. 2.17 is __________.
their names are _________________.

Step by step video solution for The number of triangles in Fig. 2.17 is __________. their names are _________________. by Maths experts to help you in doubts & scoring excellent marks in Class 6 exams.
Updated on:21/07/2023Topper's Solved these Questions
- GEOMETRYBOOK - NCERT EXEMPLARCHAPTER - GEOMETRYEXERCISE - Exercise (State whether the statements given in questions are true (T) or false (F):)
10 Videos
- GEOMETRYBOOK - NCERT EXEMPLARCHAPTER - GEOMETRYEXERCISE - Exercise
56 Videos
- GEOMETRYBOOK - NCERT EXEMPLARCHAPTER - GEOMETRYEXERCISE - Exercise (Out of foure options only one is correct. Write the correct answer.)
16 Videos
- FRACTIONS AND DECIMALS BOOK - NCERT EXEMPLARCHAPTER - FRACTIONS AND DECIMALS EXERCISE - ACTIVITY
1 Video
- INTEGERS BOOK - NCERT EXEMPLARCHAPTER - INTEGERS EXERCISE - Exercise
42 Videos
Similar Questions
A horizontal line and a vertical line always intersect at right angles.
View SolutionName all the line segments in Fig. 2.24.

View SolutionNumber of lines passing through five points such that no three of them are colinear is
View SolutionActivity: Find the number of boys and girls in your school and write:
(i) The fraction representing boys among the total students
(ii) The fraction representing girls among the total students
(iii) check that the sum of two fractions in (i) and (ii) is 1.
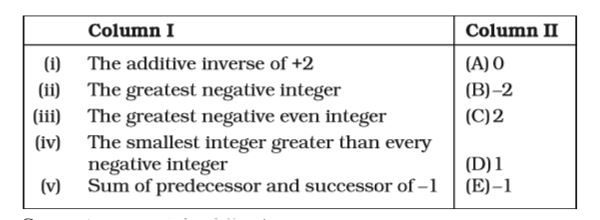
View SolutionMatch the items of Column I with that of Column II:

View SolutionHow many lines of symmetry does the above figure have ?
View SolutionWhich of the following are correct chain isomers of butane ? (i)
View SolutionDetermine the point of symmetry of a regular hexagon.
View SolutionDtermine the images of the following figure about the given line :
View SolutionMatch the following Column A to Column B

View SolutionMatch the following Column A to Column B

View SolutionMatch the following Column A to Column B

View SolutionFind the area of the figure given below.

View SolutionThe area of the shaded part in the figure given below is ______.

View SolutionThe inequation represented by the graph given below is :
View SolutionThe inequation that best describes the graph given below is _________
View Solution
