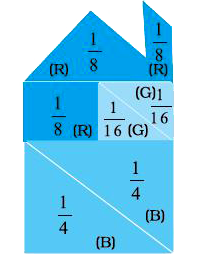
The pieces of Tangrams have been rearranged to make the given shape.

By observing the given shape, answer the following questions:
Check that the sum of all the percentages calculated above should be 100.
Step by step video solution for The pieces of Tangrams have been rearranged to make the given shape. By observing the given shape, answer the following questions: Check that the sum of all the percentages calculated above should be 100. by Maths experts to help you in doubts & scoring excellent marks in Class 7 exams.
Updated on:21/07/2023Topper's Solved these Questions
- COMPARING QUANTITIESBOOK - NCERT EXEMPLARCHAPTER - COMPARING QUANTITIESEXERCISE - THINK AND DISCUSS
24 Videos
- COMPARING QUANTITIESBOOK - NCERT EXEMPLARCHAPTER - COMPARING QUANTITIESEXERCISE - THINK AND DISCUSS
24 Videos
- ALGEBRAIC EXPRESSIONSBOOK - NCERT EXEMPLARCHAPTER - ALGEBRAIC EXPRESSIONSEXERCISE - Check understanding
1 Video
- DATA HANDLINGBOOK - NCERT EXEMPLARCHAPTER - DATA HANDLINGEXERCISE - THINK AND DISCUSS
3 Videos
Similar Questions
Describe how two ratios can form a proportion.
View SolutionDescribe how two ratios can form a proportion.
View SolutionIdentify the following terms as like or unlike.
(a) 3x, 3y (b) 7k, 3k (c) 2p, 2pt
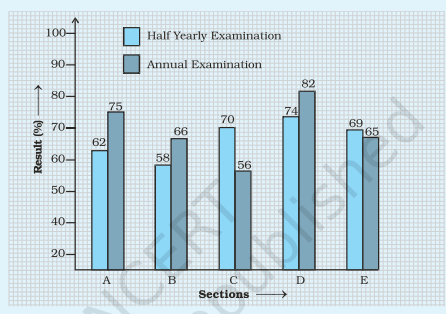
View SolutionThe double bar graph given below compares the class-averages in half yearly and annual examinations of 5 sections of Class VII.

Can you compare the ratio of difference of results of sections B and D ?
View SolutionHow many lines of symmetry does the above figure have ?
View SolutionDetermine the point of symmetry of a regular hexagon.
View SolutionDtermine the images of the following figure about the given line :
View SolutionMatch the following Column A to Column B

View SolutionMatch the following Column A to Column B

View SolutionMatch the following Column A to Column B

View SolutionFind the area of the figure given below.

View SolutionCalculate the volume of the given solid.
ltimg src="https://d10lpgp6xz60nq.cloudfront.net/physics_images/PS_MATH_VII_C06_E03_002_Q01.png" width="80%"gt
View SolutionThe area of the shaded part in the figure given below is ______.

View SolutionThe inequation represented by the graph given below is :
View SolutionThe inequation that best describes the graph given below is _________
View SolutionThe inequation that best describes the following graph is _________
View Solution
