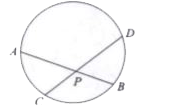
Two chords AB and CD of a circle intersects each other at P. which of the following is correct?

AP×PB=CP×PD
AP+PB=CP×PD
AP−PB=CP−PD
AP×CP=BP×PD
The correct Answer is:A
Topper's Solved these Questions
- CIRCLES AND CYCLIC QUADRILATERALS BOOK - CENGAGECHAPTER - CIRCLES AND CYCLIC QUADRILATERALS EXERCISE - OLYMPIAD AND NTSE LEVEL EXERCISES
10 Videos
- CIRCLES AND CYCLIC QUADRILATERALS BOOK - CENGAGECHAPTER - CIRCLES AND CYCLIC QUADRILATERALS EXERCISE - OLYMPIAD AND NTSE LEVEL EXERCISES
10 Videos
- BINOMIAL THEOREMBOOK - CENGAGECHAPTER - BINOMIAL THEOREMEXERCISE - TEST YOURSELF (Multiple Choice Questions) OLYMPIAD AND NTSE LEVEL EXERCISES
10 Videos
- DETERMINANTSBOOK - CENGAGECHAPTER - DETERMINANTSEXERCISE - Puzziles and games
5 Videos
Similar Questions
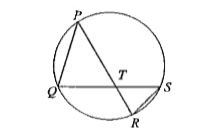
In the figures ∠PQT=p,∠TSR=q,and∠PTQ=60∘ Then p+q equals

View SolutionIn the figures ∠PQT=p,∠TSR=q,and∠PTQ=60∘ Then p+q equals

View SolutionIf rthand(r+1)th terms in the expansion of (p+q)n are equal, then (n+1)qr(p+q) is
View SolutionA 150 - m - long steamer has changed its direction through 30 degrees while moving through a distance equal to twice its own length. What is the radius of the circle in which it has moved ?
View SolutionIn the given figure (not to scale), O is the centre of the circle. A,B,C and D are concyclic and AB=CD . If /_MON =120^(@) , then find /_ OPN .
View SolutionWhich of the following are correct chain isomers of butane ? (i)
View SolutionDetermine the point of symmetry of a regular hexagon.
View SolutionDtermine the images of the following figure about the given line :
View SolutionIn the figure above (not to scale), ¯¯¯¯¯¯AB⊥¯¯¯¯¯¯CDandAD is the bisector of ∠BAE.AB=3cm and AC=5cm. Find CD.
View SolutionMatch the following Column A to Column B

View SolutionMatch the following Column A to Column B

View SolutionMatch the following Column A to Column B

View SolutionThe inequation represented by the graph given below is :
View SolutionThe inequation that best describes the graph given below is _________
View SolutionThe inequation that best describes the following graph is _________
View SolutionWhich inequations represent the shaded region in the given figure
View Solution

