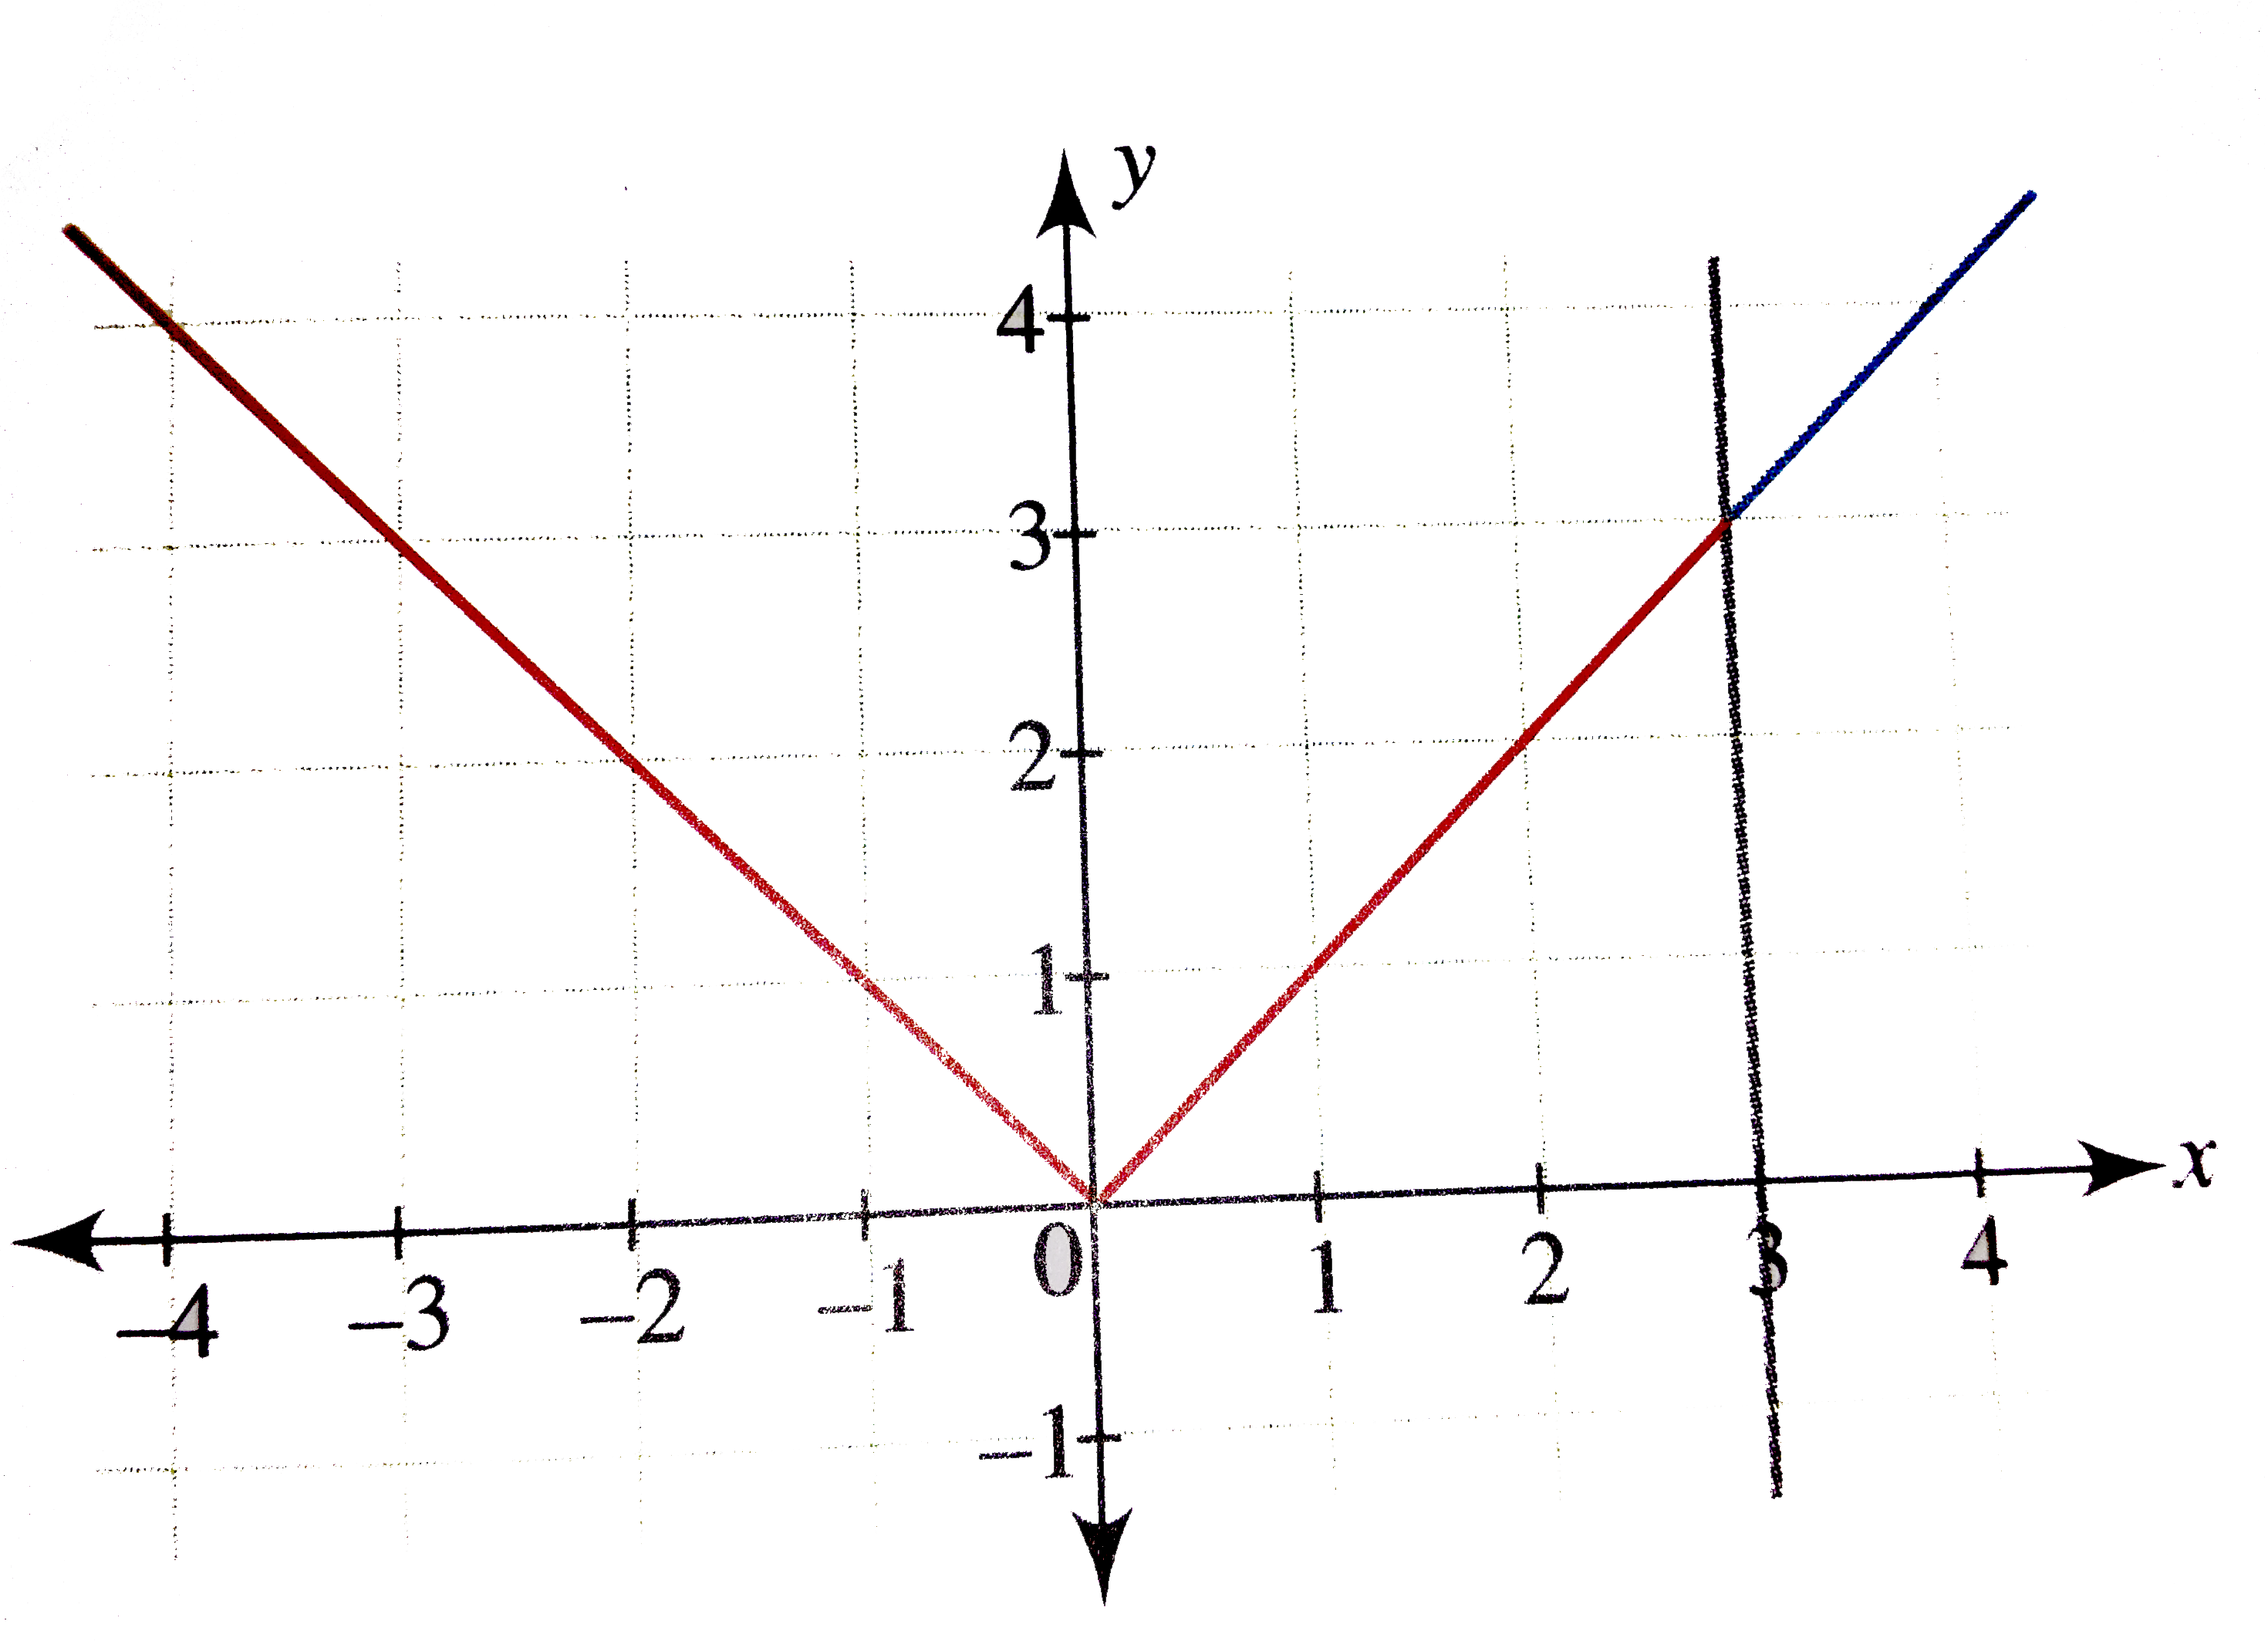
When x<3, find the values of |x| graphically.

From the graph, |x|≥0(red-lined graph).
Topper's Solved these Questions
- GRAPHS OF ELEMENTARY FUNCTIONS Book:CENGAGEChapter:GRAPHS OF ELEMENTARY FUNCTIONS Exercise:Exercise
Explore 34 Videos
- GRAPHS OF POLYNOMIAL AND RATIONAL FUNCTIONSBook:CENGAGEChapter:GRAPHS OF POLYNOMIAL AND RATIONAL FUNCTIONSExercise:Exercise
Explore 13 Videos
- GRAPHS OF TRIGONOMETRIC FUNCTIONSBook:CENGAGEChapter:GRAPHS OF TRIGONOMETRIC FUNCTIONSExercise:Exercise
Explore 22 Videos
Similar Questions
Draw the graph of y=1(1/x).
View SolutionDraw the graph of y=(x−1)(x2−x+1).
View SolutionDraw the graph of y= cosec 2x−cot2x. Is f(x) periodic ? If yes, what is its fundamental period ?
View SolutionIf x<2, then find the values of x2 graphically.
View SolutionIf x<−1, then find the values of 1/x graphically.
View SolutionWhen x<3, find the values of 1/x.
View SolutionWhen x>−2, find the values of |x| graphically.
View SolutionIf x<2, then find the values of x2 graphically.
View SolutionIf x<−1, then find the values of x2 graphically.
View SolutionIf x<−1, then find the values of 1/x graphically.
View SolutionWhen x<3, find the values of 1/x.
View SolutionWhen x<3, find the values of |x| graphically.
View SolutionIf x lt 2 , then find the values of x^(2) graphically.
View SolutionIf x lt -1 , then find the values of 1//x graphically.
View SolutionWhen x lt 3 , find the values of 1//x .
View Solution
