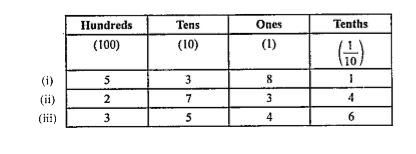
Write these fractions appropriately as additions or subtractions.
 Solution in Punjabi
The correct Answer is:25
Step by step video & text solution for Write these fractions appropriately as additions or subtractions. by Maths experts to help you in doubts & scoring excellent marks in Class 6 exams.
Updated on:21/07/2023Topper's Solved these Questions
- FRACTIONSBook:NAND LAL PUBLICATIONChapter:FRACTIONSExercise:EXERCISE 7.6
Explore 25 Videos
- FRACTIONSBook:NAND LAL PUBLICATIONChapter:FRACTIONSExercise:ADDITIONAL QUESTIONS FOR PRACTICE
Explore 52 Videos
- FRACTIONSBook:NAND LAL PUBLICATIONChapter:FRACTIONSExercise:EXERCISE 7.4
Explore 36 Videos
- DECIMALSBook:NAND LAL PUBLICATIONChapter:DECIMALSExercise:TRY THESE
Explore 13 Videos
- KNOWING OUR NUMBERSBook:NAND LAL PUBLICATIONChapter:KNOWING OUR NUMBERSExercise:SAMPLE PAPER FOR PRACTICE
Explore 19 Videos
Similar Questions
Solve:
2/3 + 1/7
View SolutionAnswer the multiple choice questions.
5795 in lowest terms is
View SolutionWrite shaded portion as fraction.Arrange them in ascending and descending order using correct sign'<','=','>' between the fractions:

View SolutionCan you write the following as decimals?

View SolutionWrite the expressions for the statements given below
Divide the difference of 14 and 6 by 2.
View SolutionIdentify the cell organelle 'A' :-
ltimg src="https://d10lpgp6xz60nq.cloudfront.net/physics_images/ALN_BIO_C10_E08_018_Q01.png" width="80%"gt
View SolutionHow many lines of symmetry does the above figure have ?
View SolutionWhich of the following are correct chain isomers of butane ? (i)
View SolutionDetermine the point of symmetry of a regular hexagon.
View SolutionDtermine the images of the following figure about the given line :
View SolutionMatch the following Column A to Column B

View SolutionMatch the following Column A to Column B

View SolutionMatch the following Column A to Column B

View SolutionFind the area of the figure given below.

View SolutionThe area of the shaded part in the figure given below is ______.

View SolutionThe inequation represented by the graph given below is :
View Solution