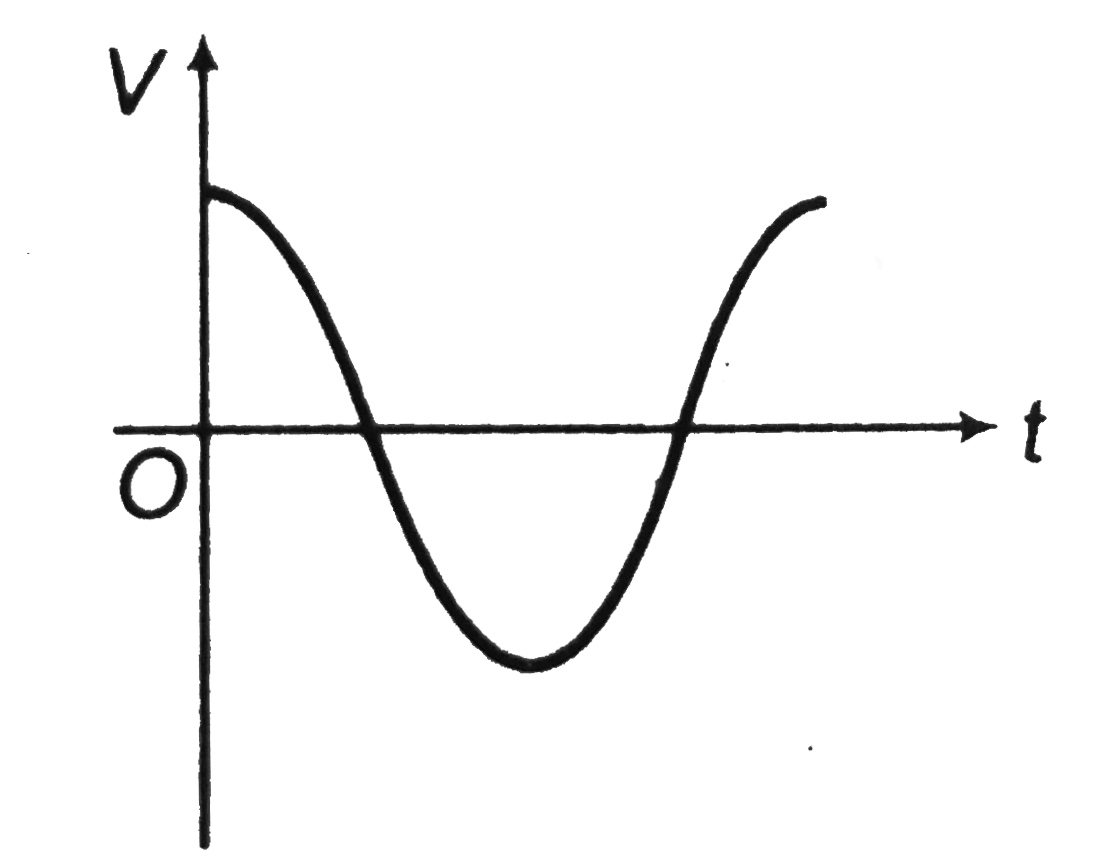
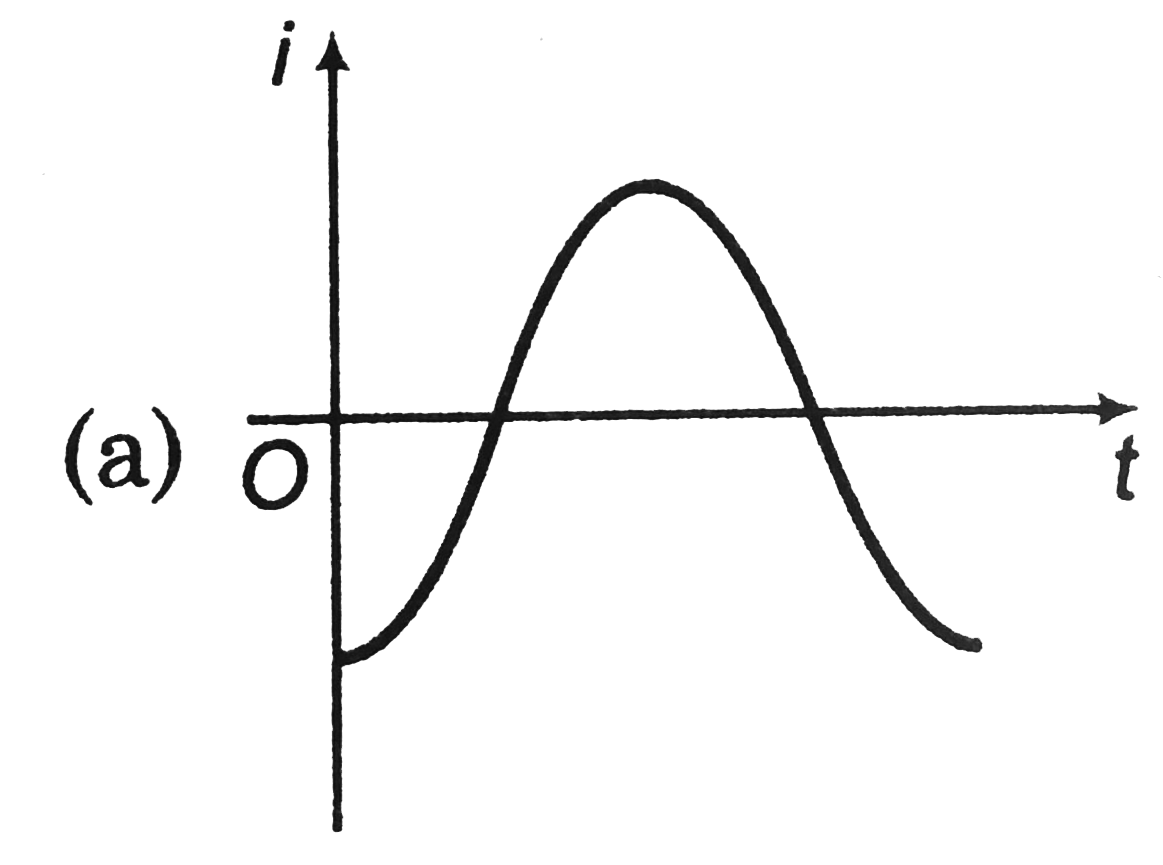
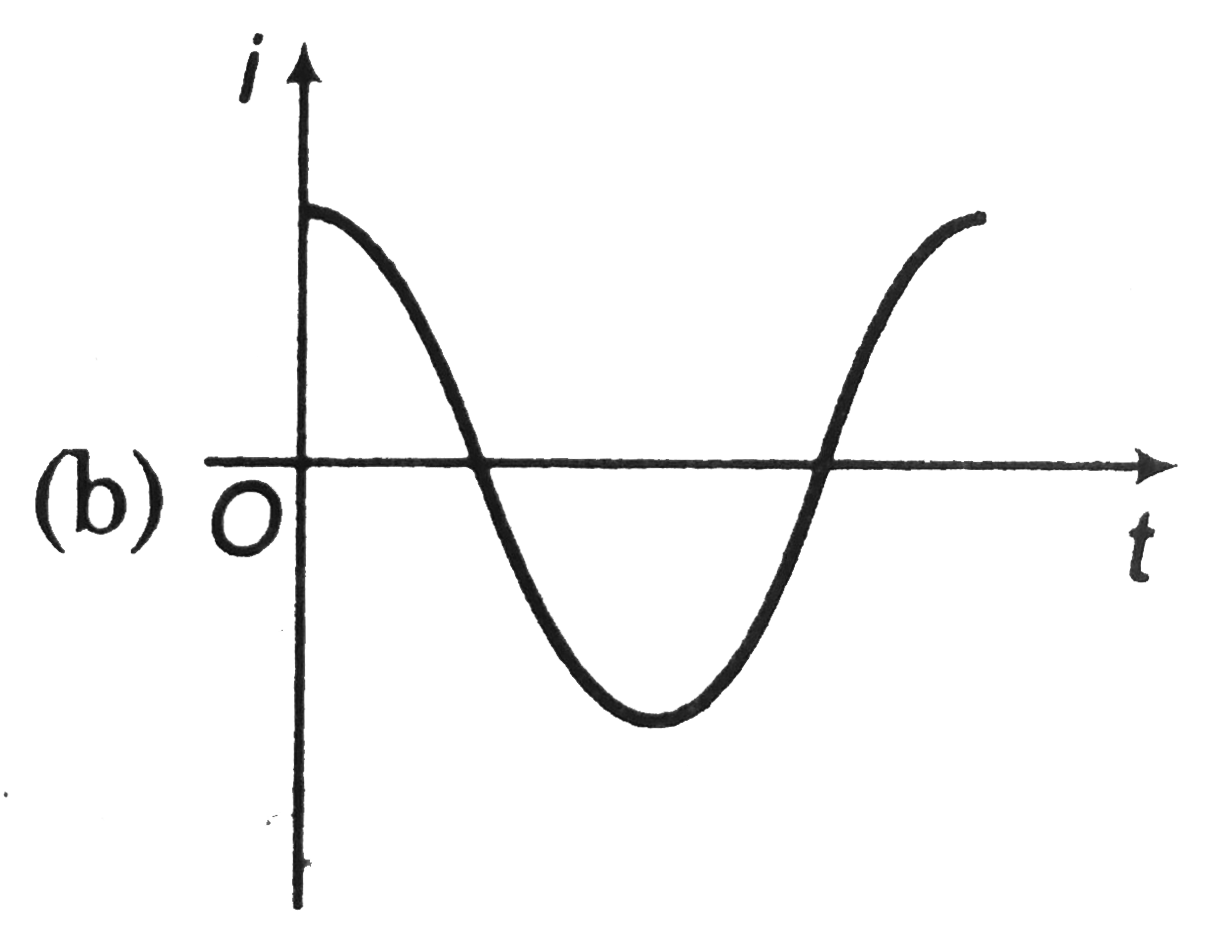
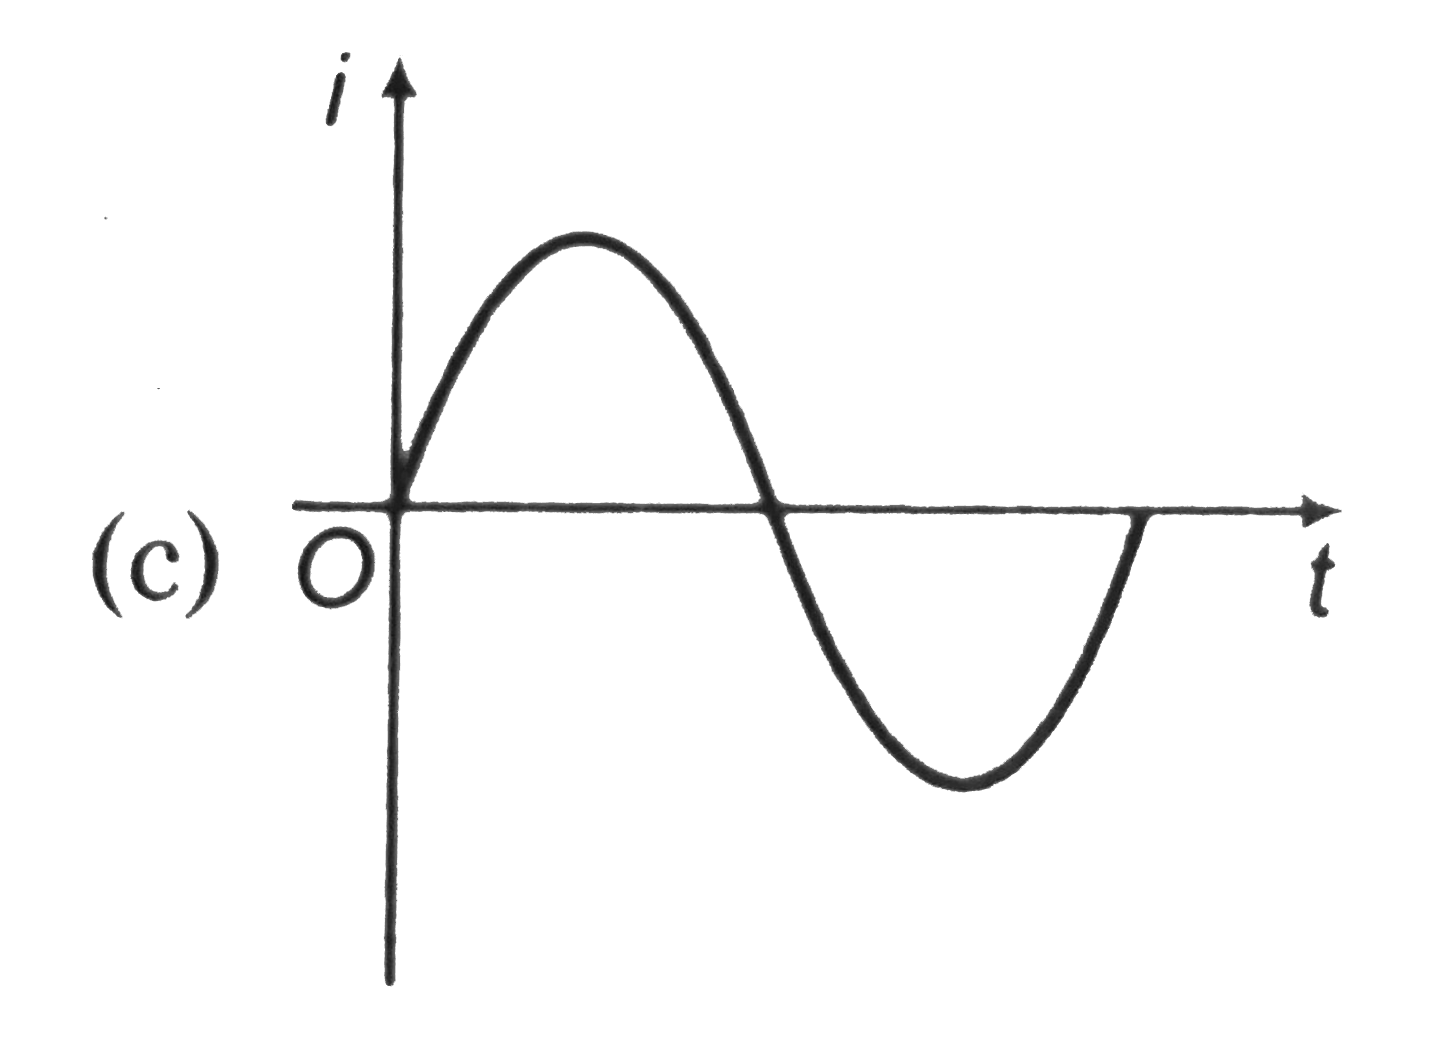
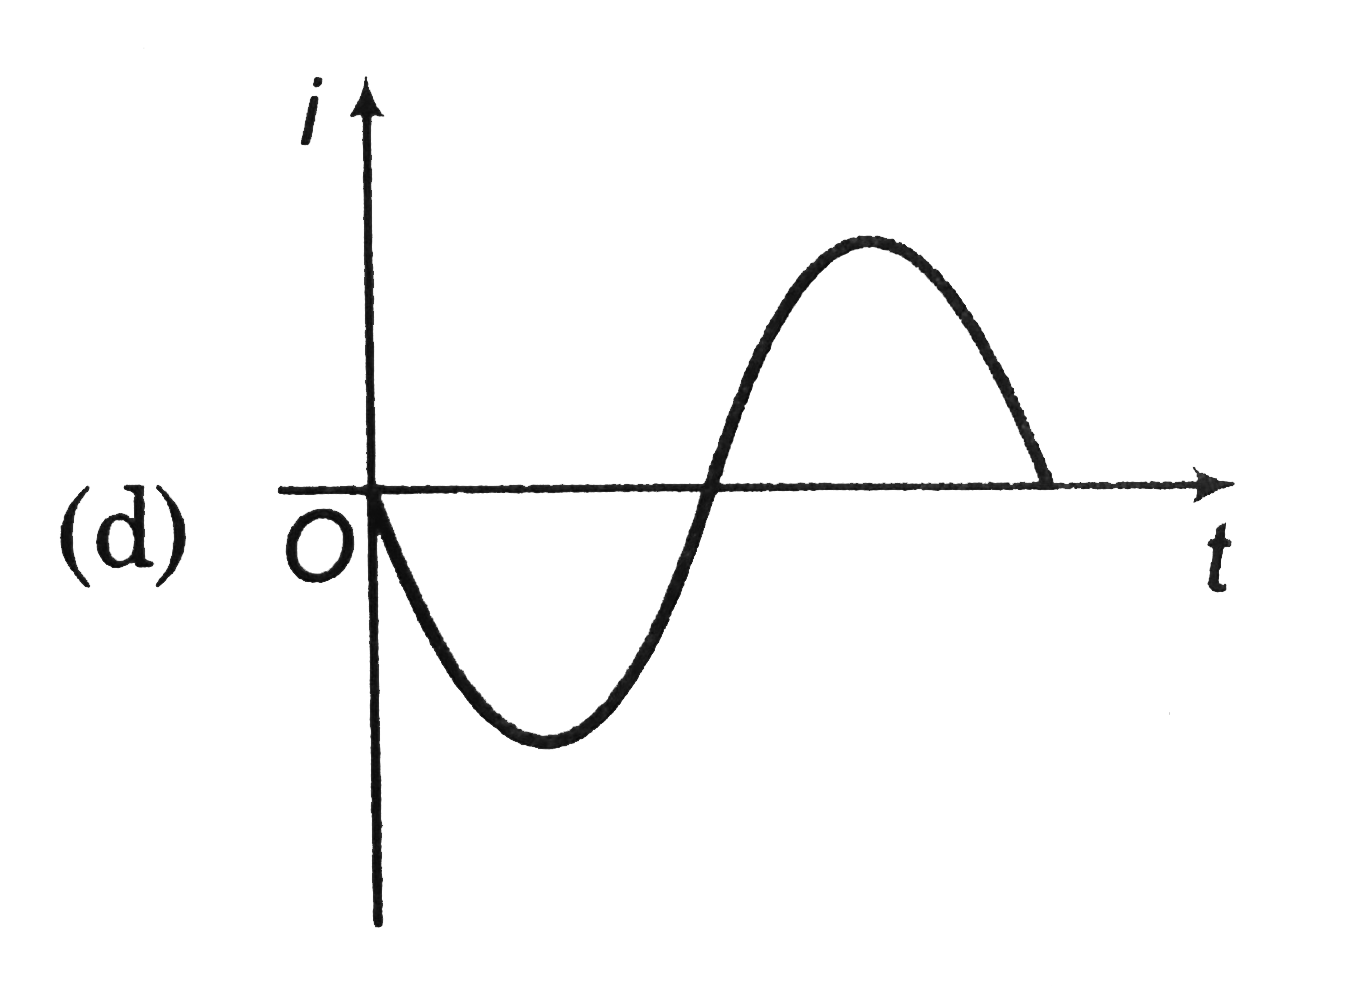
The figure represents the voltage applied across a pure inductor. The diagram which correctly represents the variation of current i with time t is given by
 .
.
A
B
C
D
Video Solution
Text Solution
The correct Answer is:C
VL function is cos function, which is 90∘ ahead of the current function. Hence, current function should be sin function.
|
Similar Questions
Knowledge Check
The figure represents the voltage applied across a pure inductor. The diagram which correctly represents the variation of current i with time t is given by
 .A
.A B
B C
C D
D
Which of the following diagrams correctly represents the counter pattern ?
A B
B C
C D
D
The figure shows P - V diagram of a thermodynamic cycle
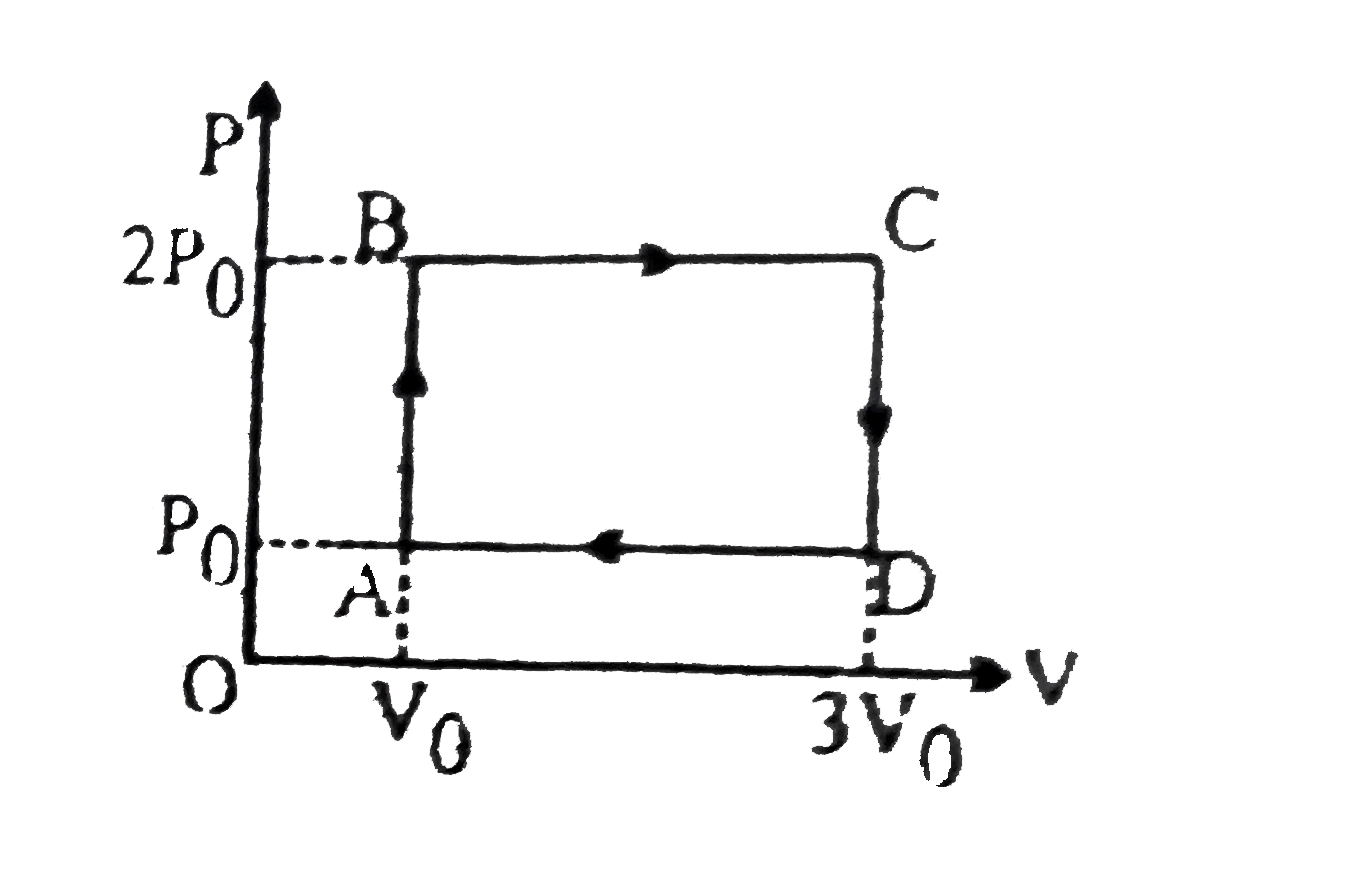
Identify the diagram which correctly represents the heat inflow and outflow of the systemA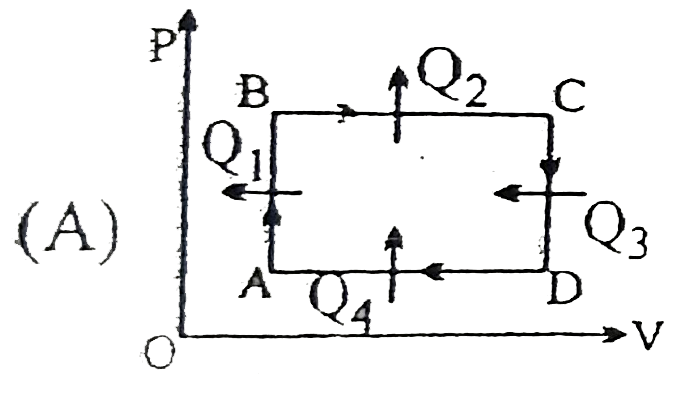 B
B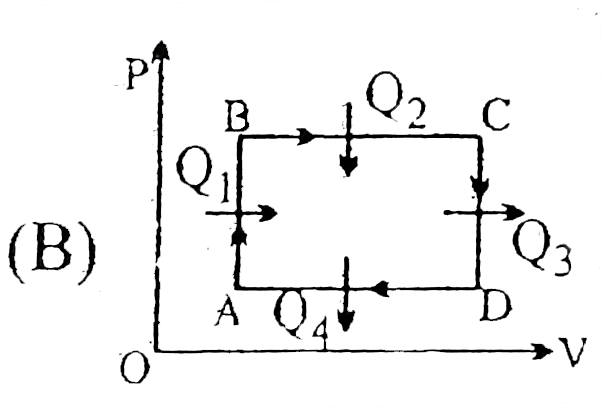 C
C D
D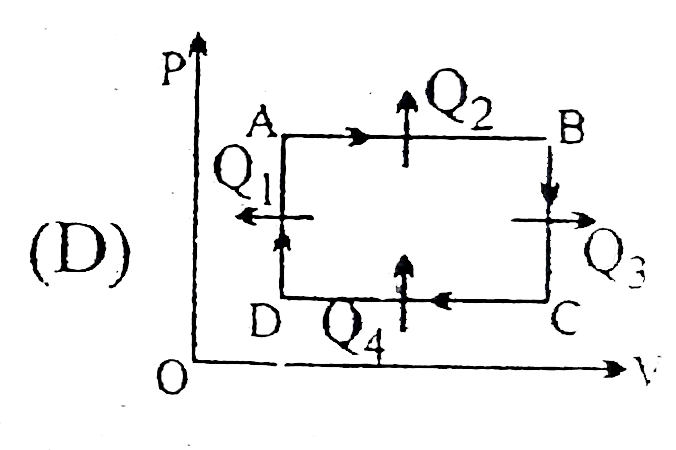
An a.c. voltage is applied to a pure inductor L, drives a current in the inductor. The current in the inductor would be
View SolutionAn a.c. voltage is applied to a pure inductor L and drives a current in the inductor. The currentn in the inductor would be
View SolutionFor the diagram given for an ideal gas, out of the following which one correctly represent the diagram?
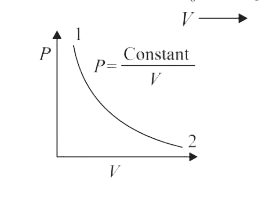
View SolutionA constant voltage at different frequencies is applied across a capacitance C as shown in the figure. Which of the following graphs correctly depicts the variation of current with frequency
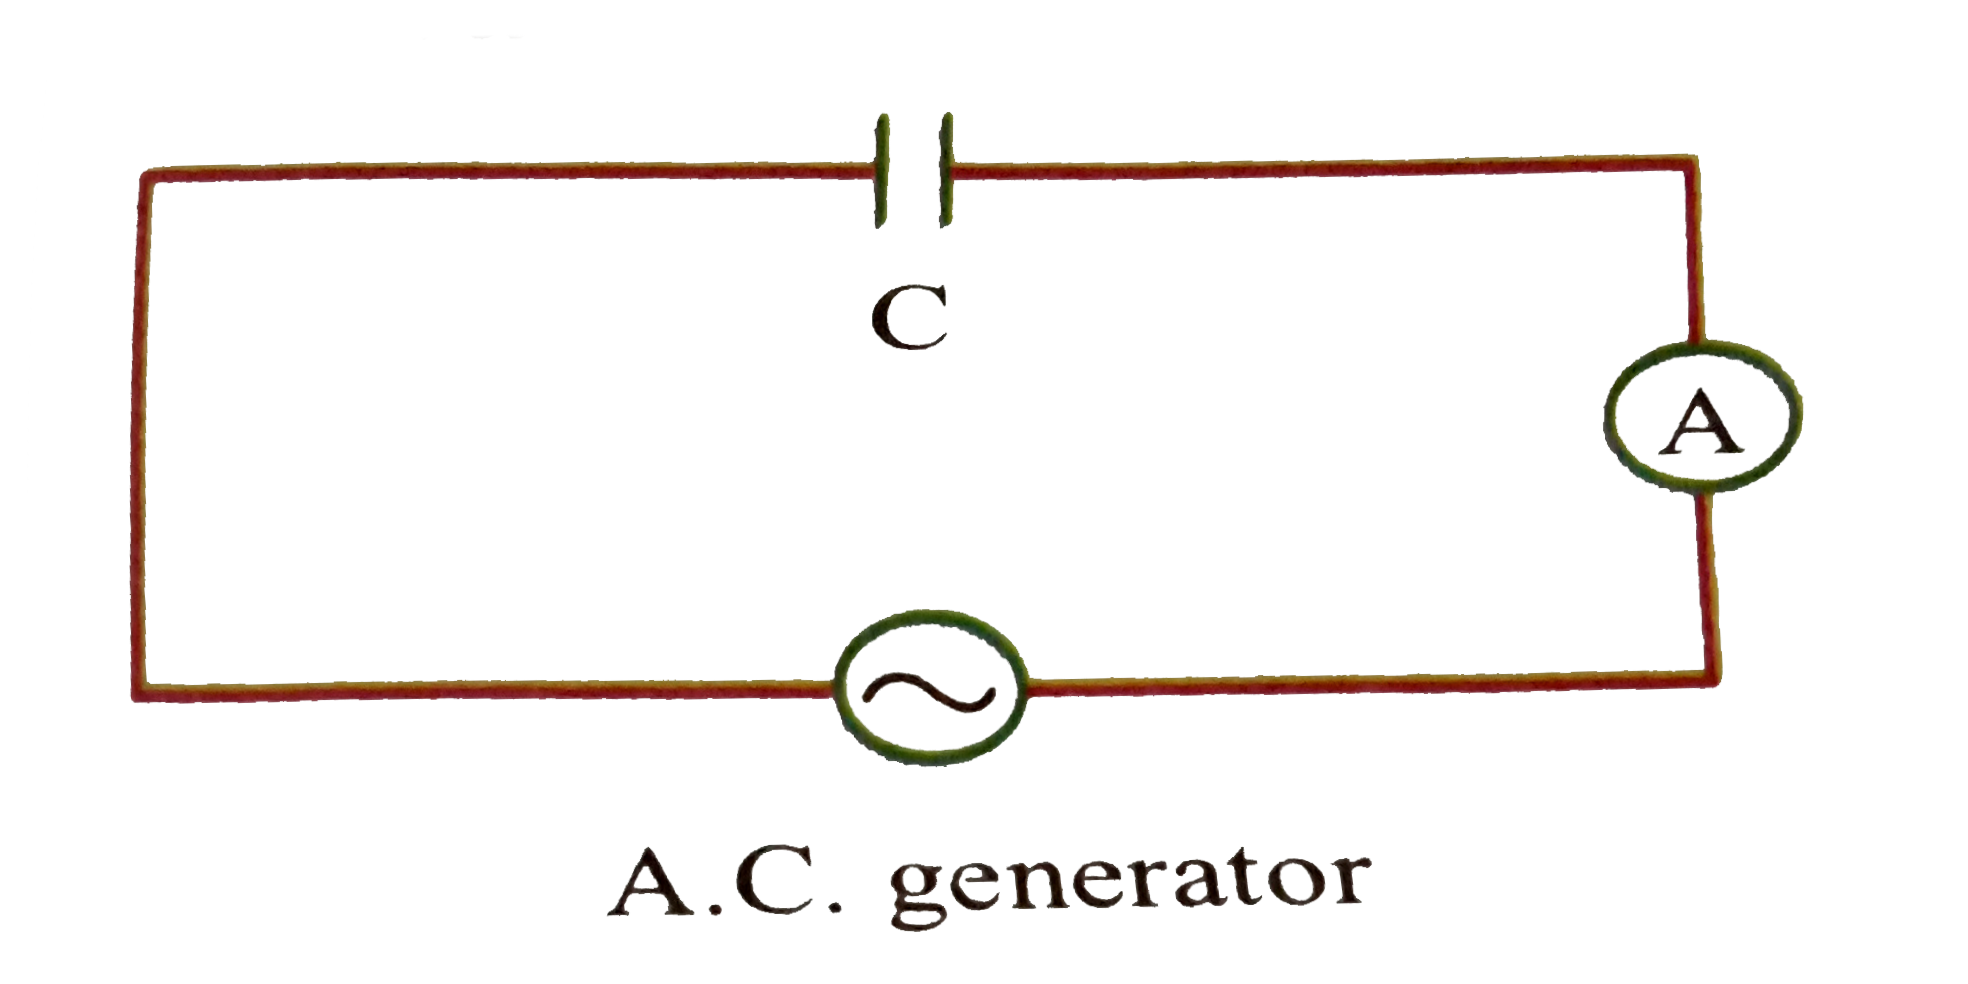
View SolutionA constant voltage at different frequencies is applied across a capacitance C as shown in the figure.
Which of the following graphs correctly depicts the variation of current with frequency?
View Solution
