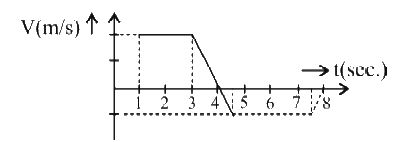
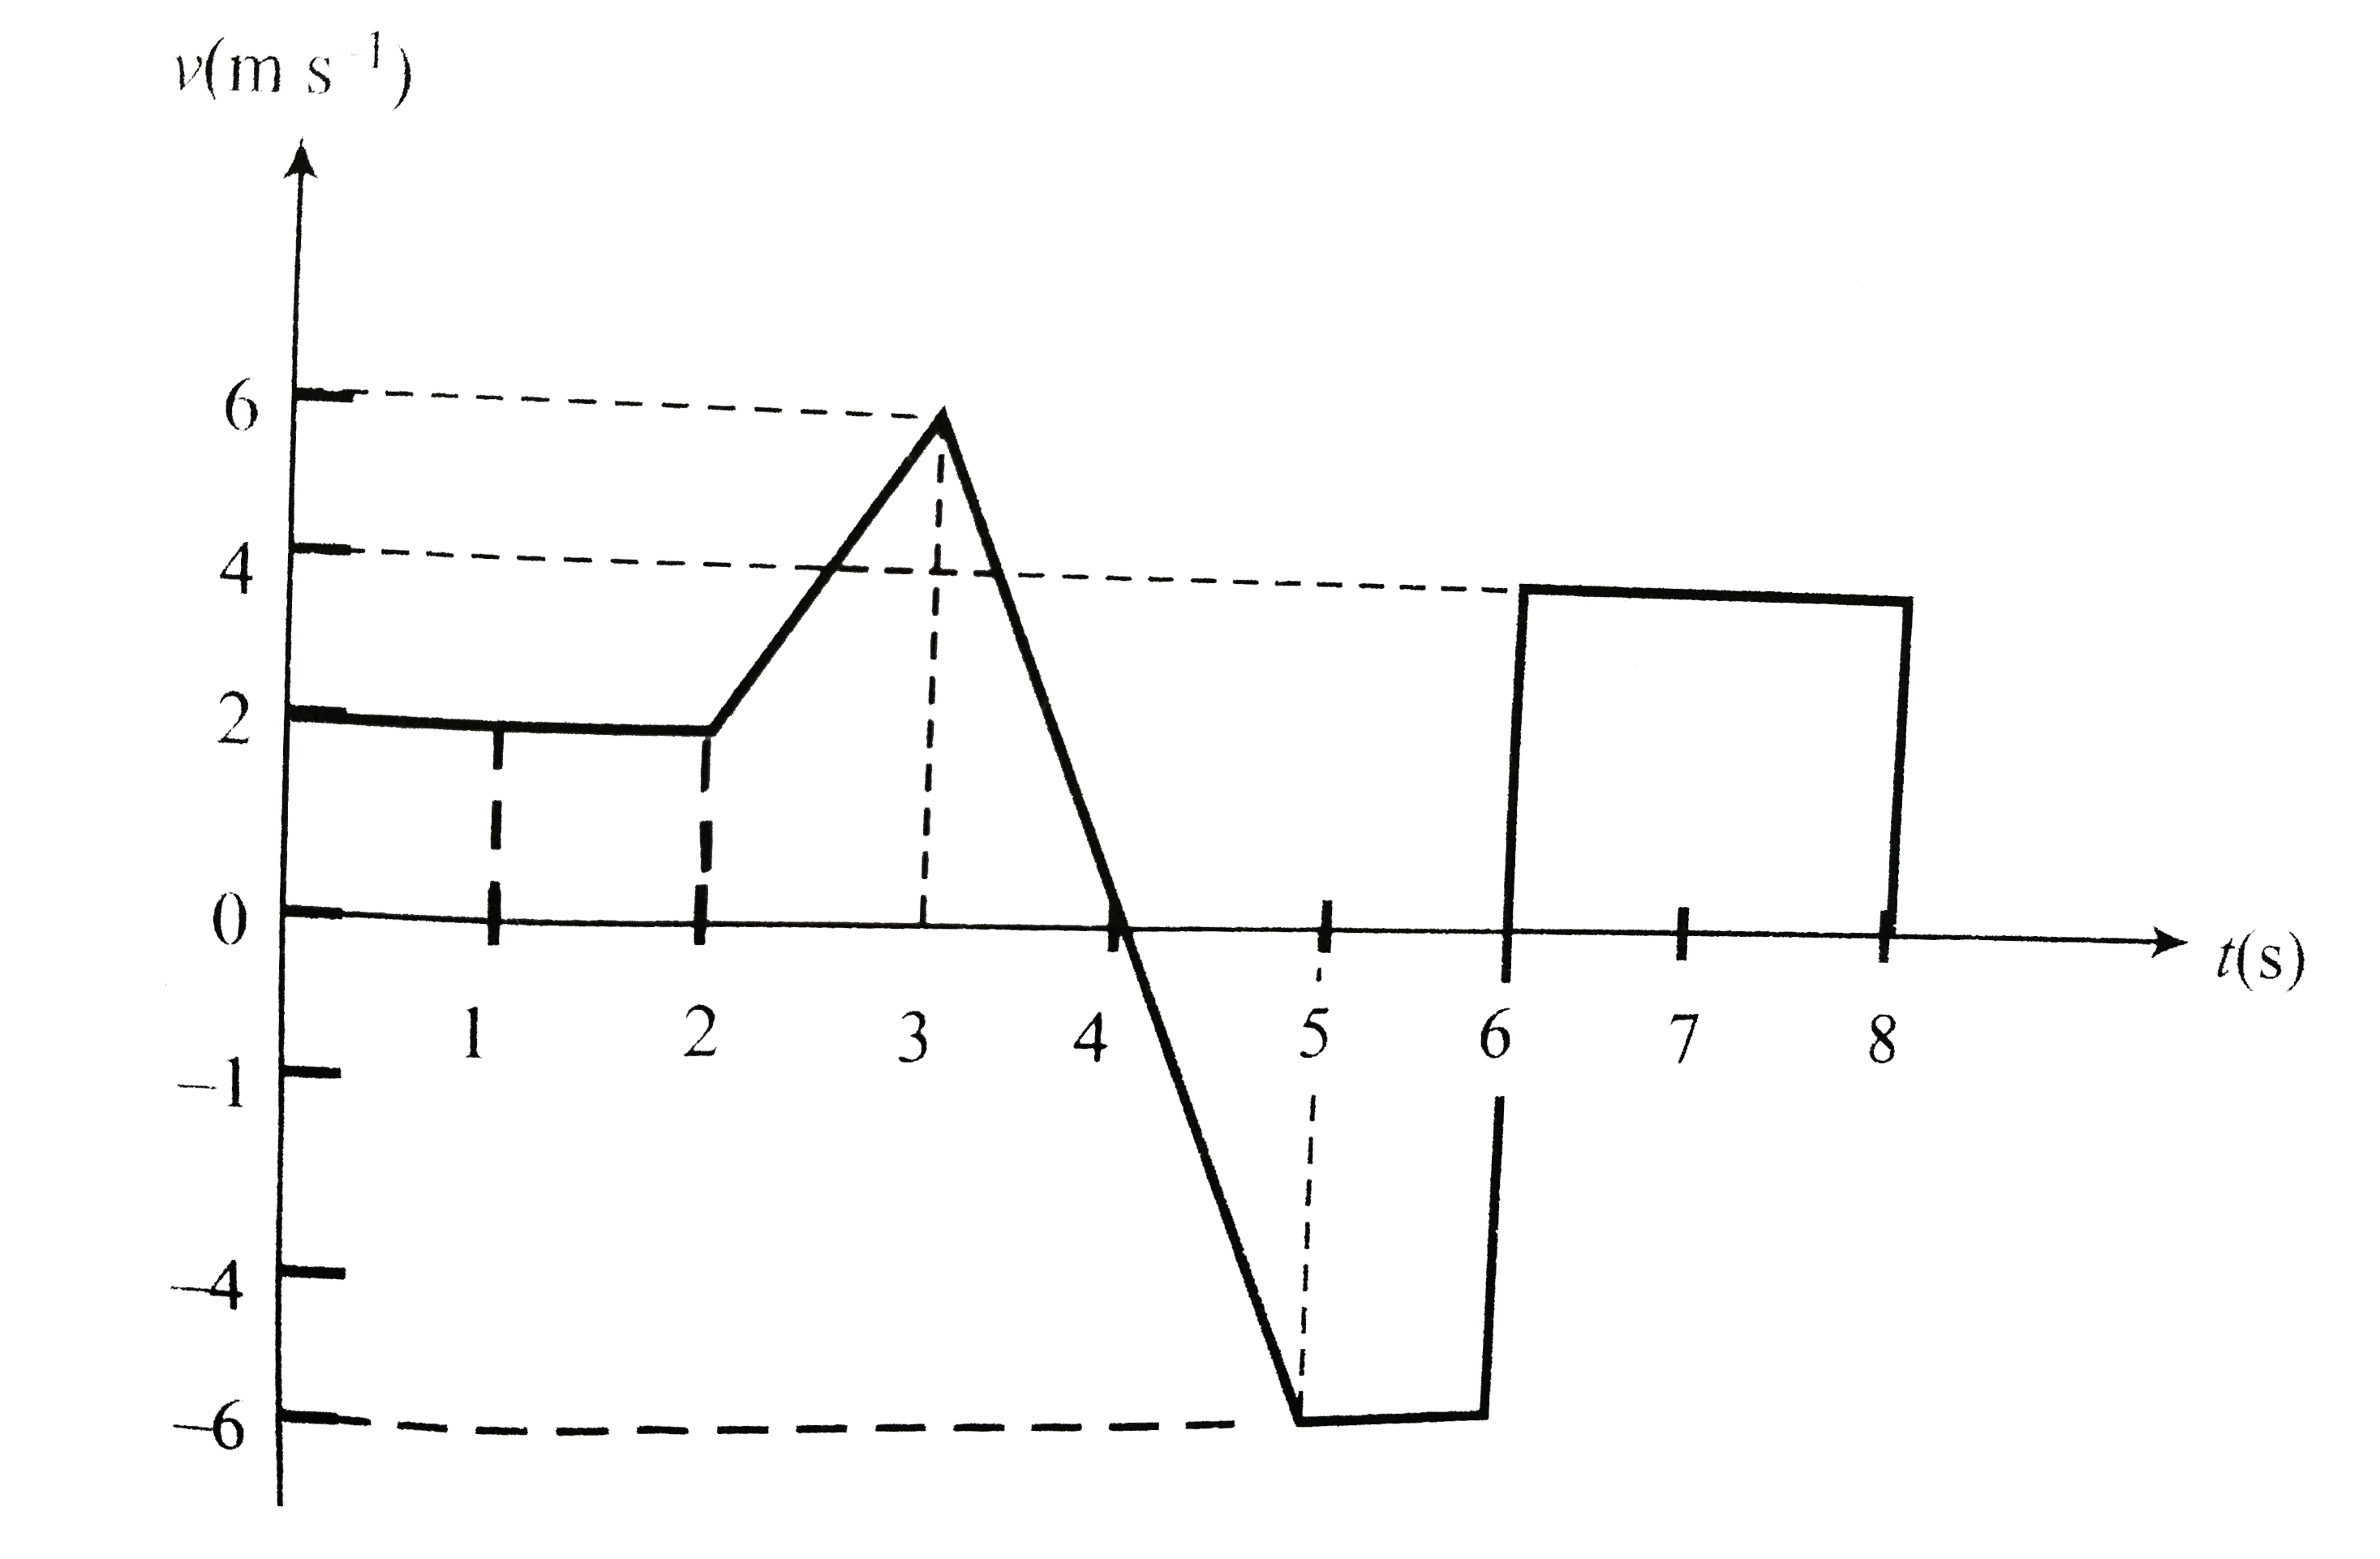
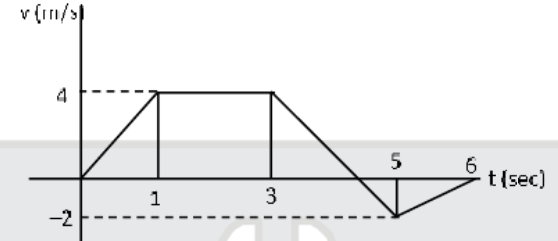
The velocity-time graph of a body is shown in .
The displacement of the body in 8s is.
 .
.
A
9m
B
12m
C
10m
D
28m
Video Solution
Text Solution
The correct Answer is:C
Displacement =Are under graph
=2×2+12(2+6)×1
+12×1×6−12×1×6−1×6+2×4
=10m.
|
Similar Questions
Knowledge Check
Velocity-time graph of a body thrown vertically up is
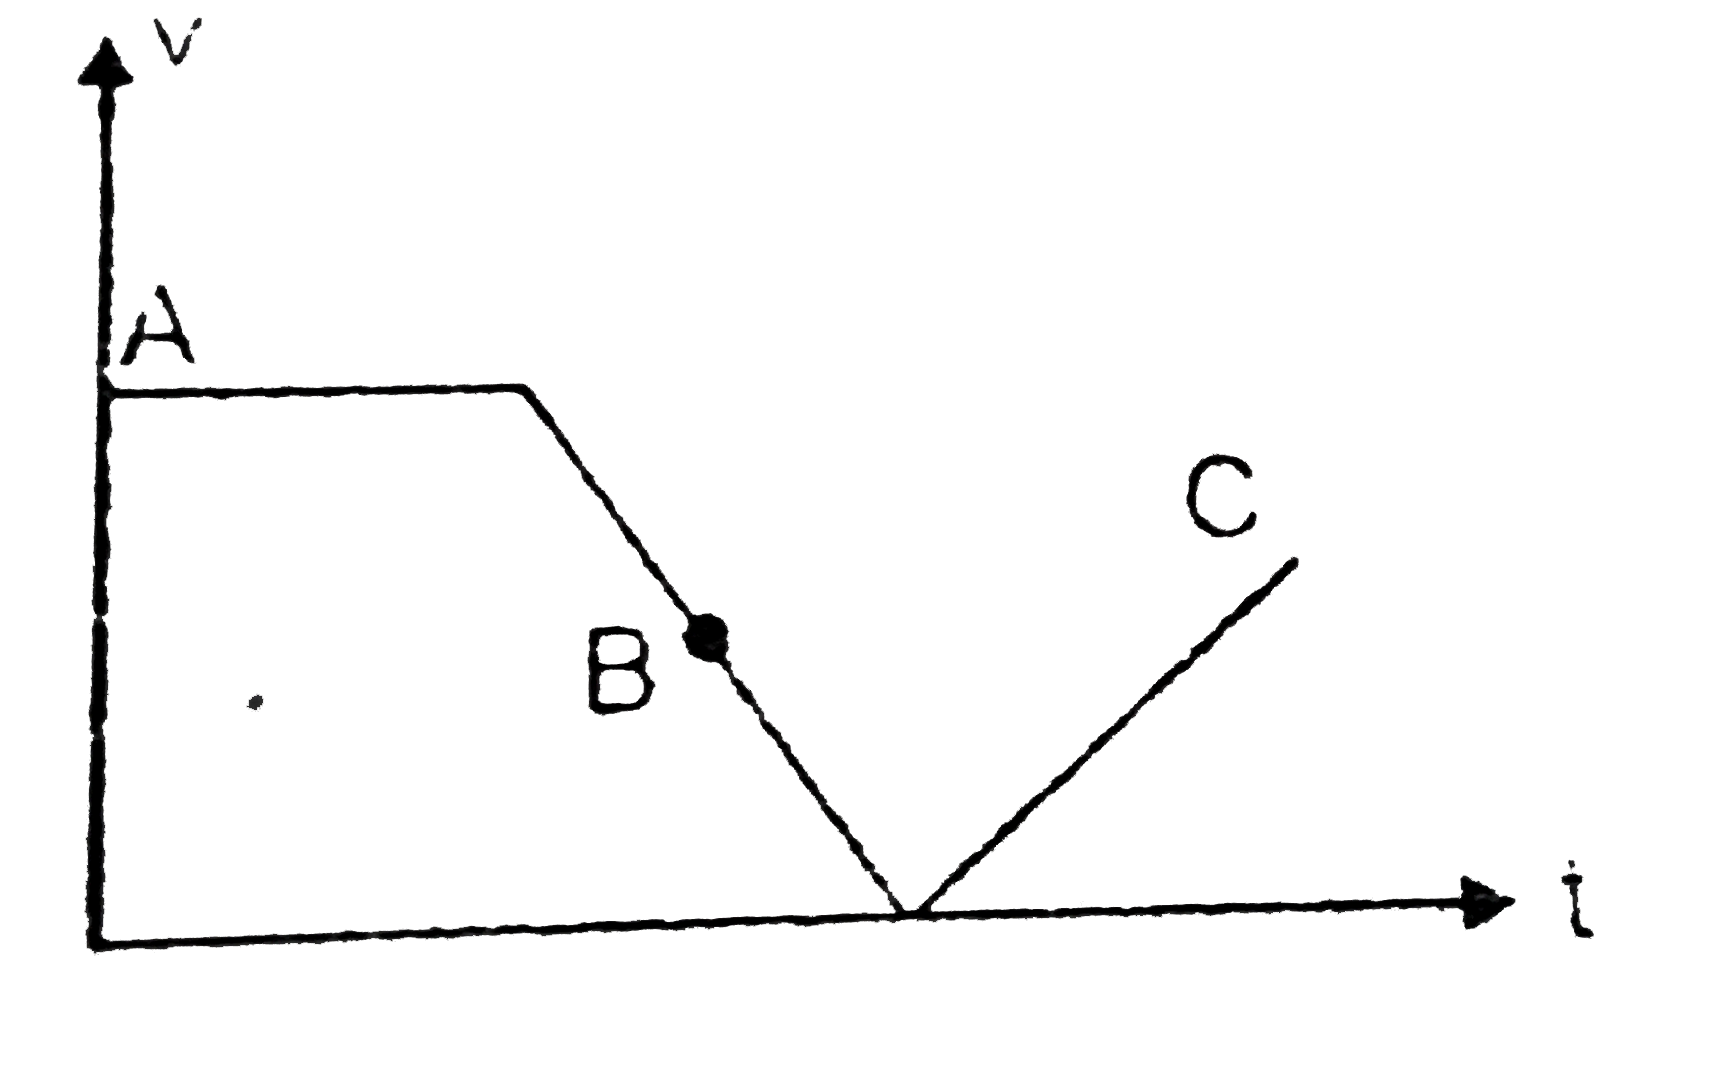
Aa straight lineBa parabolaCa hyperbolaDcircleThe velocity-time graph of a body is shown in the figure, it implies that at point B
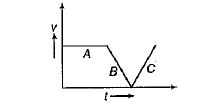 Athe force Is zeroBthere is a force toward motionCthere Is a force which opposes motionDthere is only gravitational force
The velocity-time graph of a linear motion is shown in figure. The displacement & distance from the origin after 8 sec is :-
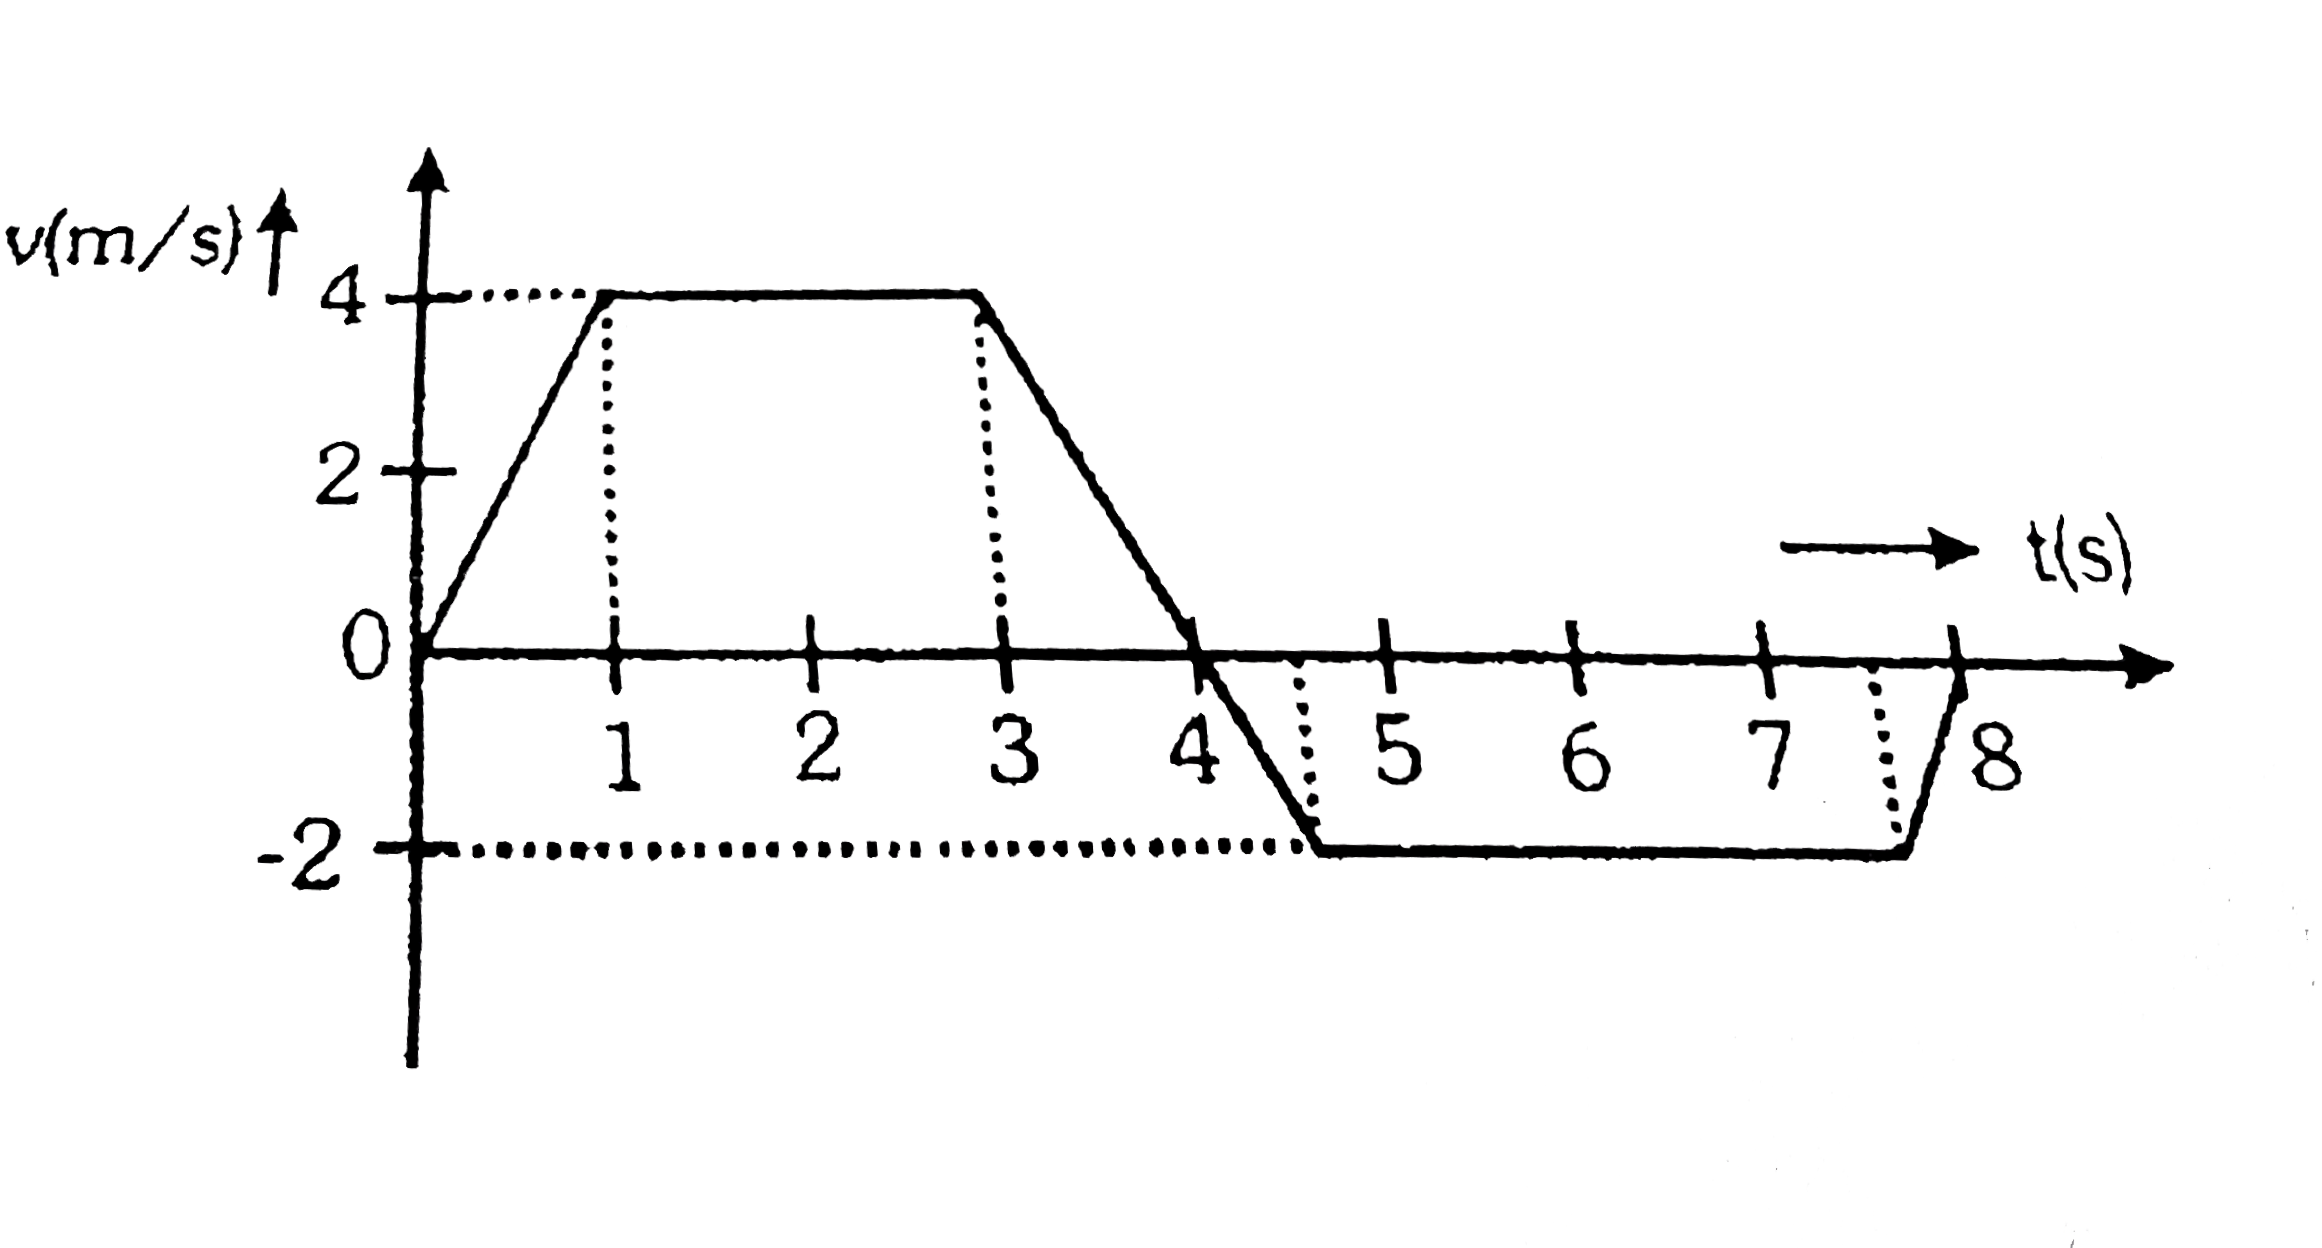 A5m,19mB16m,22mC8m,19mD6m,5m
The velocity time graph of a body is as showh in
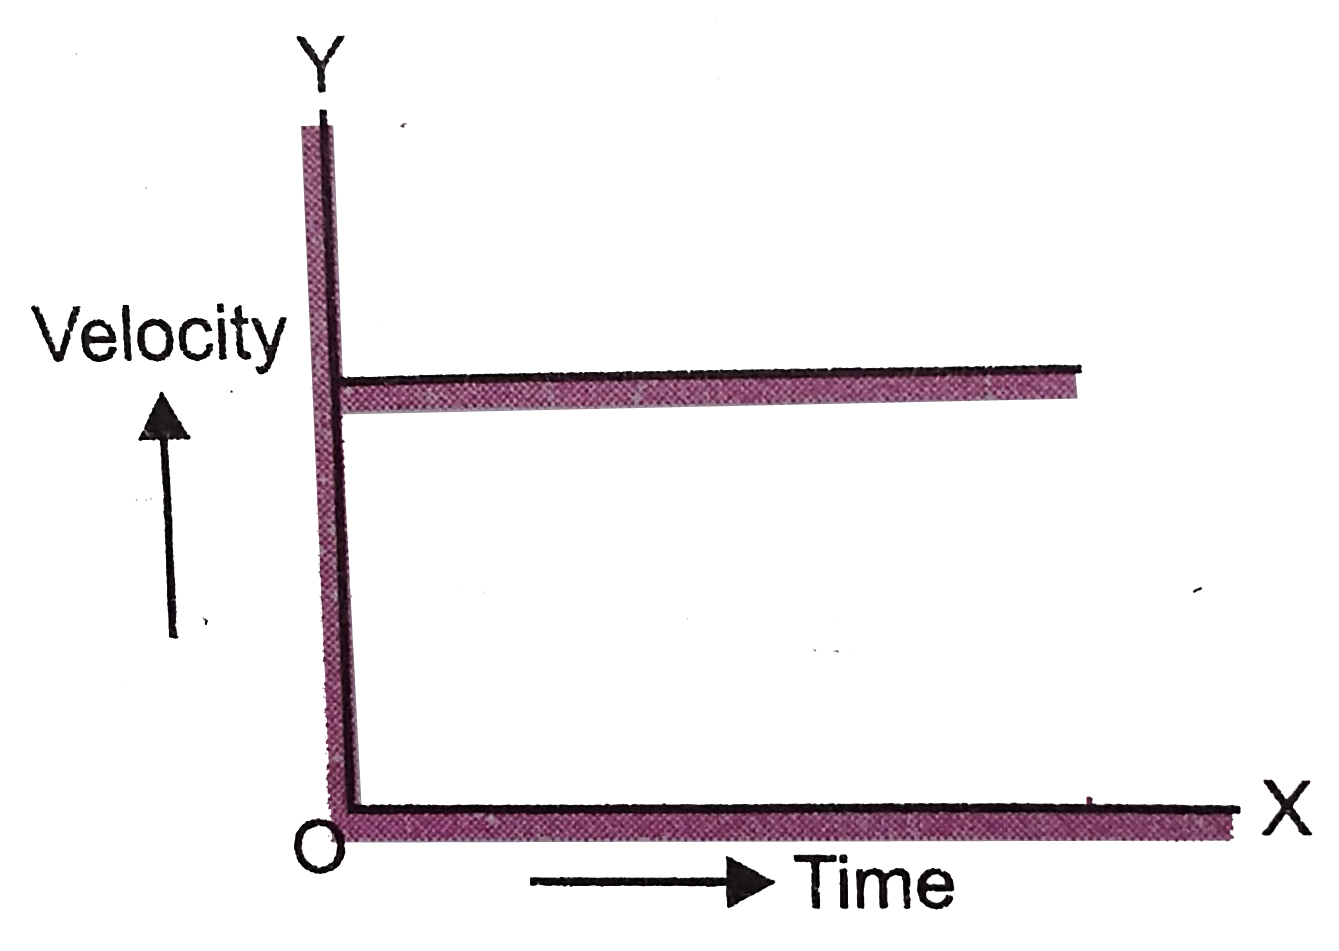
what would be the acceleration of the body ?
View SolutionIn the following velocity-time graph of a body, the distance and displacement travelled by the body in 5 seconds in meters will be:
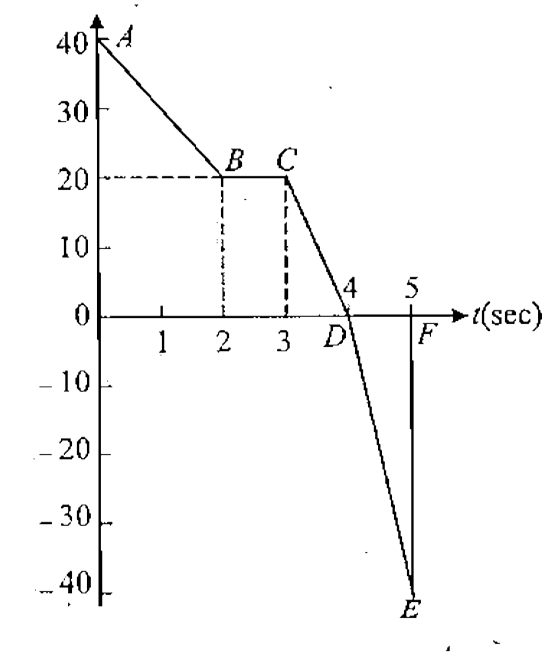
View SolutionVelocity versus time graph of a body is shown in figure. It explains that
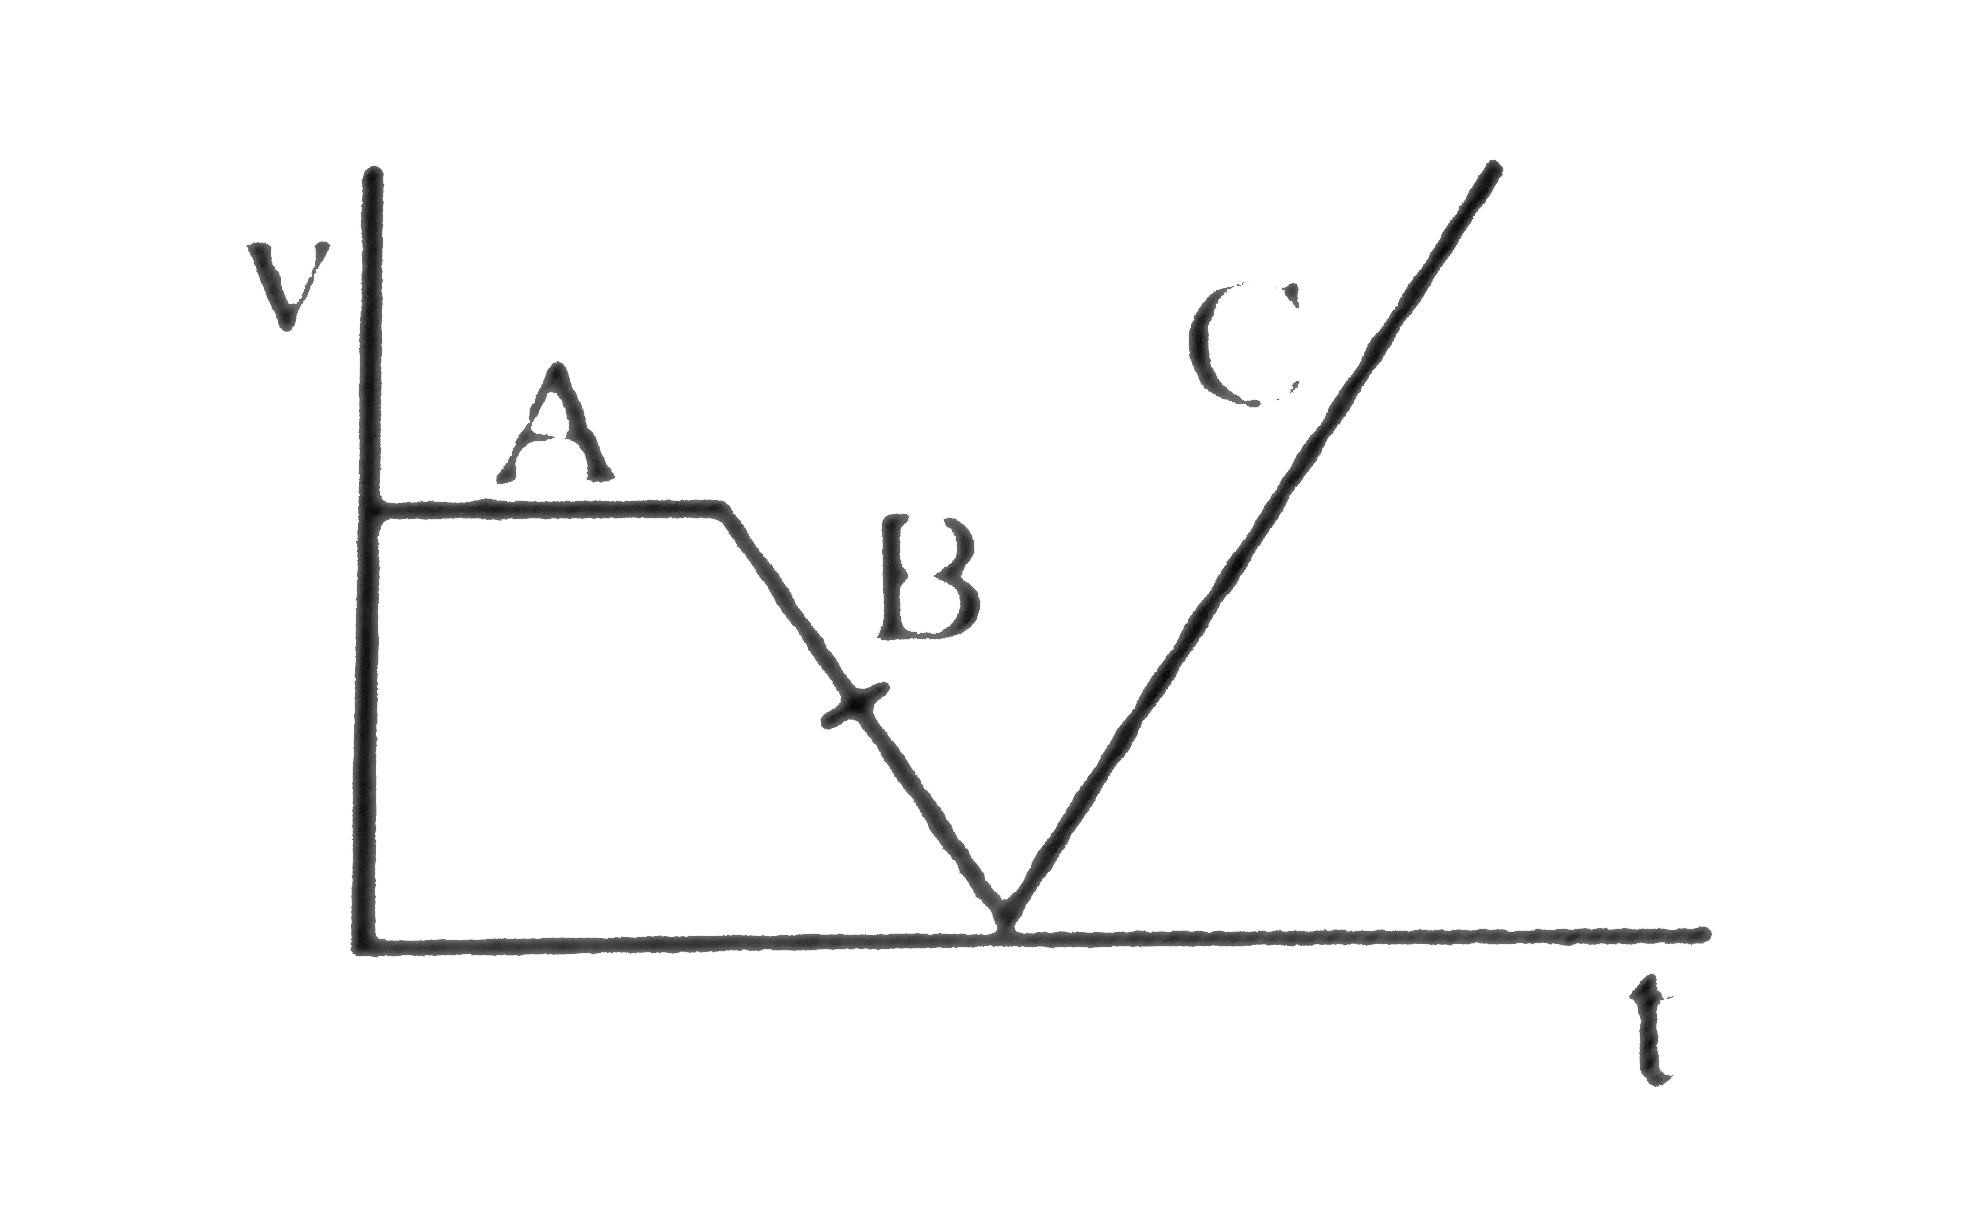
View SolutionIf velocity-time graph of a body is as shown in figure, what is the nature of motion ?
View Solutionvelocity time graph of a particle is shown in figure. Find displacement of the particle.
View Solution

