The velocity time graphs of two bodies A and B are shown in Figure. Observe these graphs carefully and answer the following questions :
(i) From the shape of graphs, what is nature of motion of A and B
(ii) What do you infer from the slopes of the graphs ?
(iii) What are the initial velocities of A and B ?
(iv) What is acceleration of A ?
(v) What is acceleration of B ?
(vi) What distance is travelled by B before coming to rest ?
(vii) At what time will the two bodies have equal velocity ?
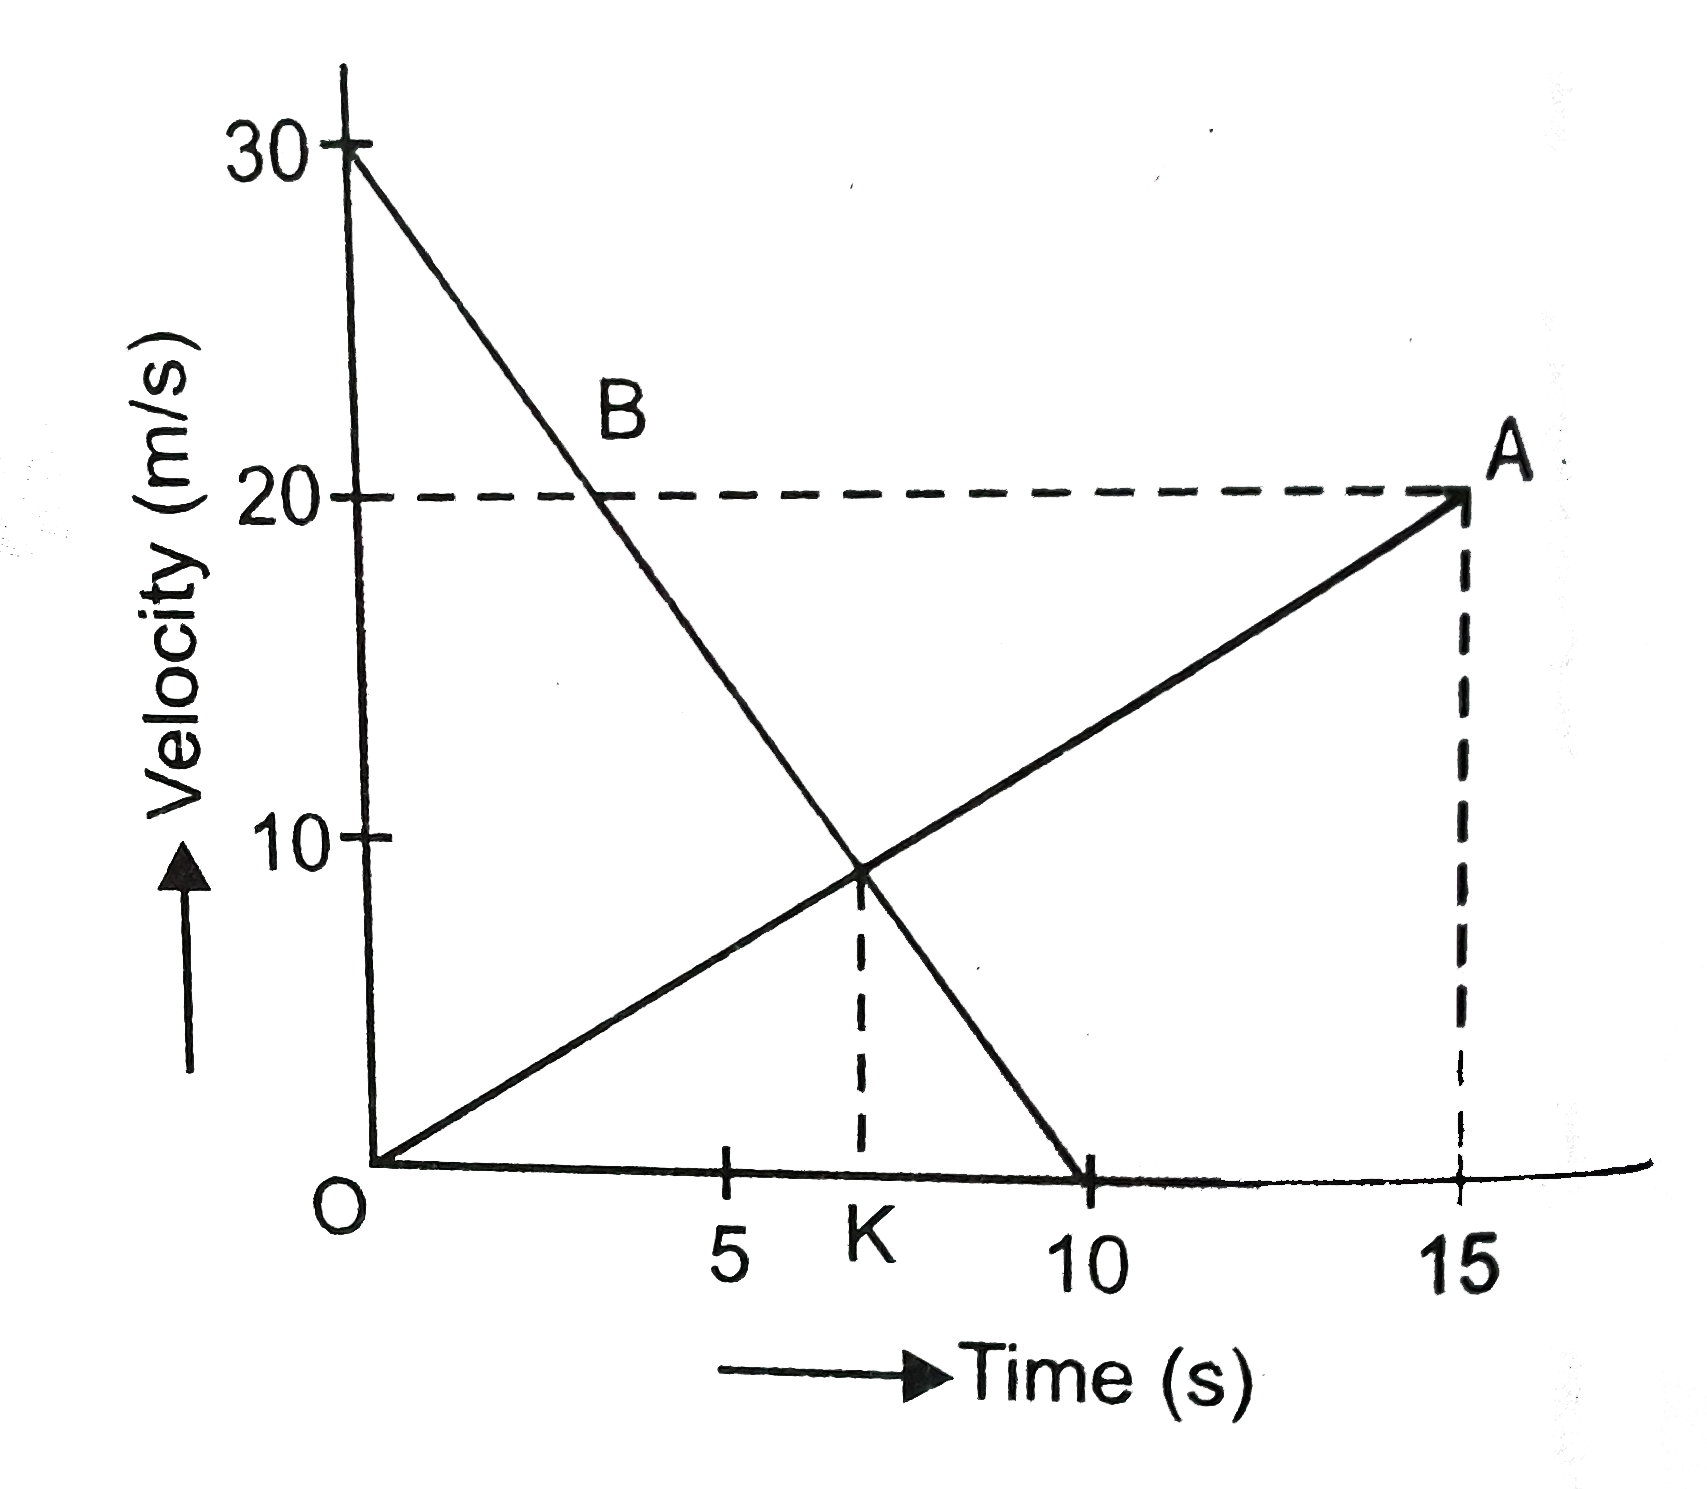
(i) As vel-time graph of AandB are straight lines, both the bodies have uniformly acclerated motion.
(ii) Slope of A is positive. So acceleration of A is positive. Slope of B is negative. So acceleration of B is negative, i.e., B moves with retardation.
(iii) Initial vel. of A=0. Initial vel. of B=30m/s
Ac c. of A =change of vel.time taken=20−015=1.33m/s2
(v) Ac c. of B =Change of vel.time taken=0−3010=−3m/s2 Negative sign indicates retardation
(vi) distance travelled = Area under vel.time graph of B=30×102=150m
(vii) From the graph, velocity of A = vel. of B at t=OK, whose value can be read from the scale on the graph.
Similar Questions
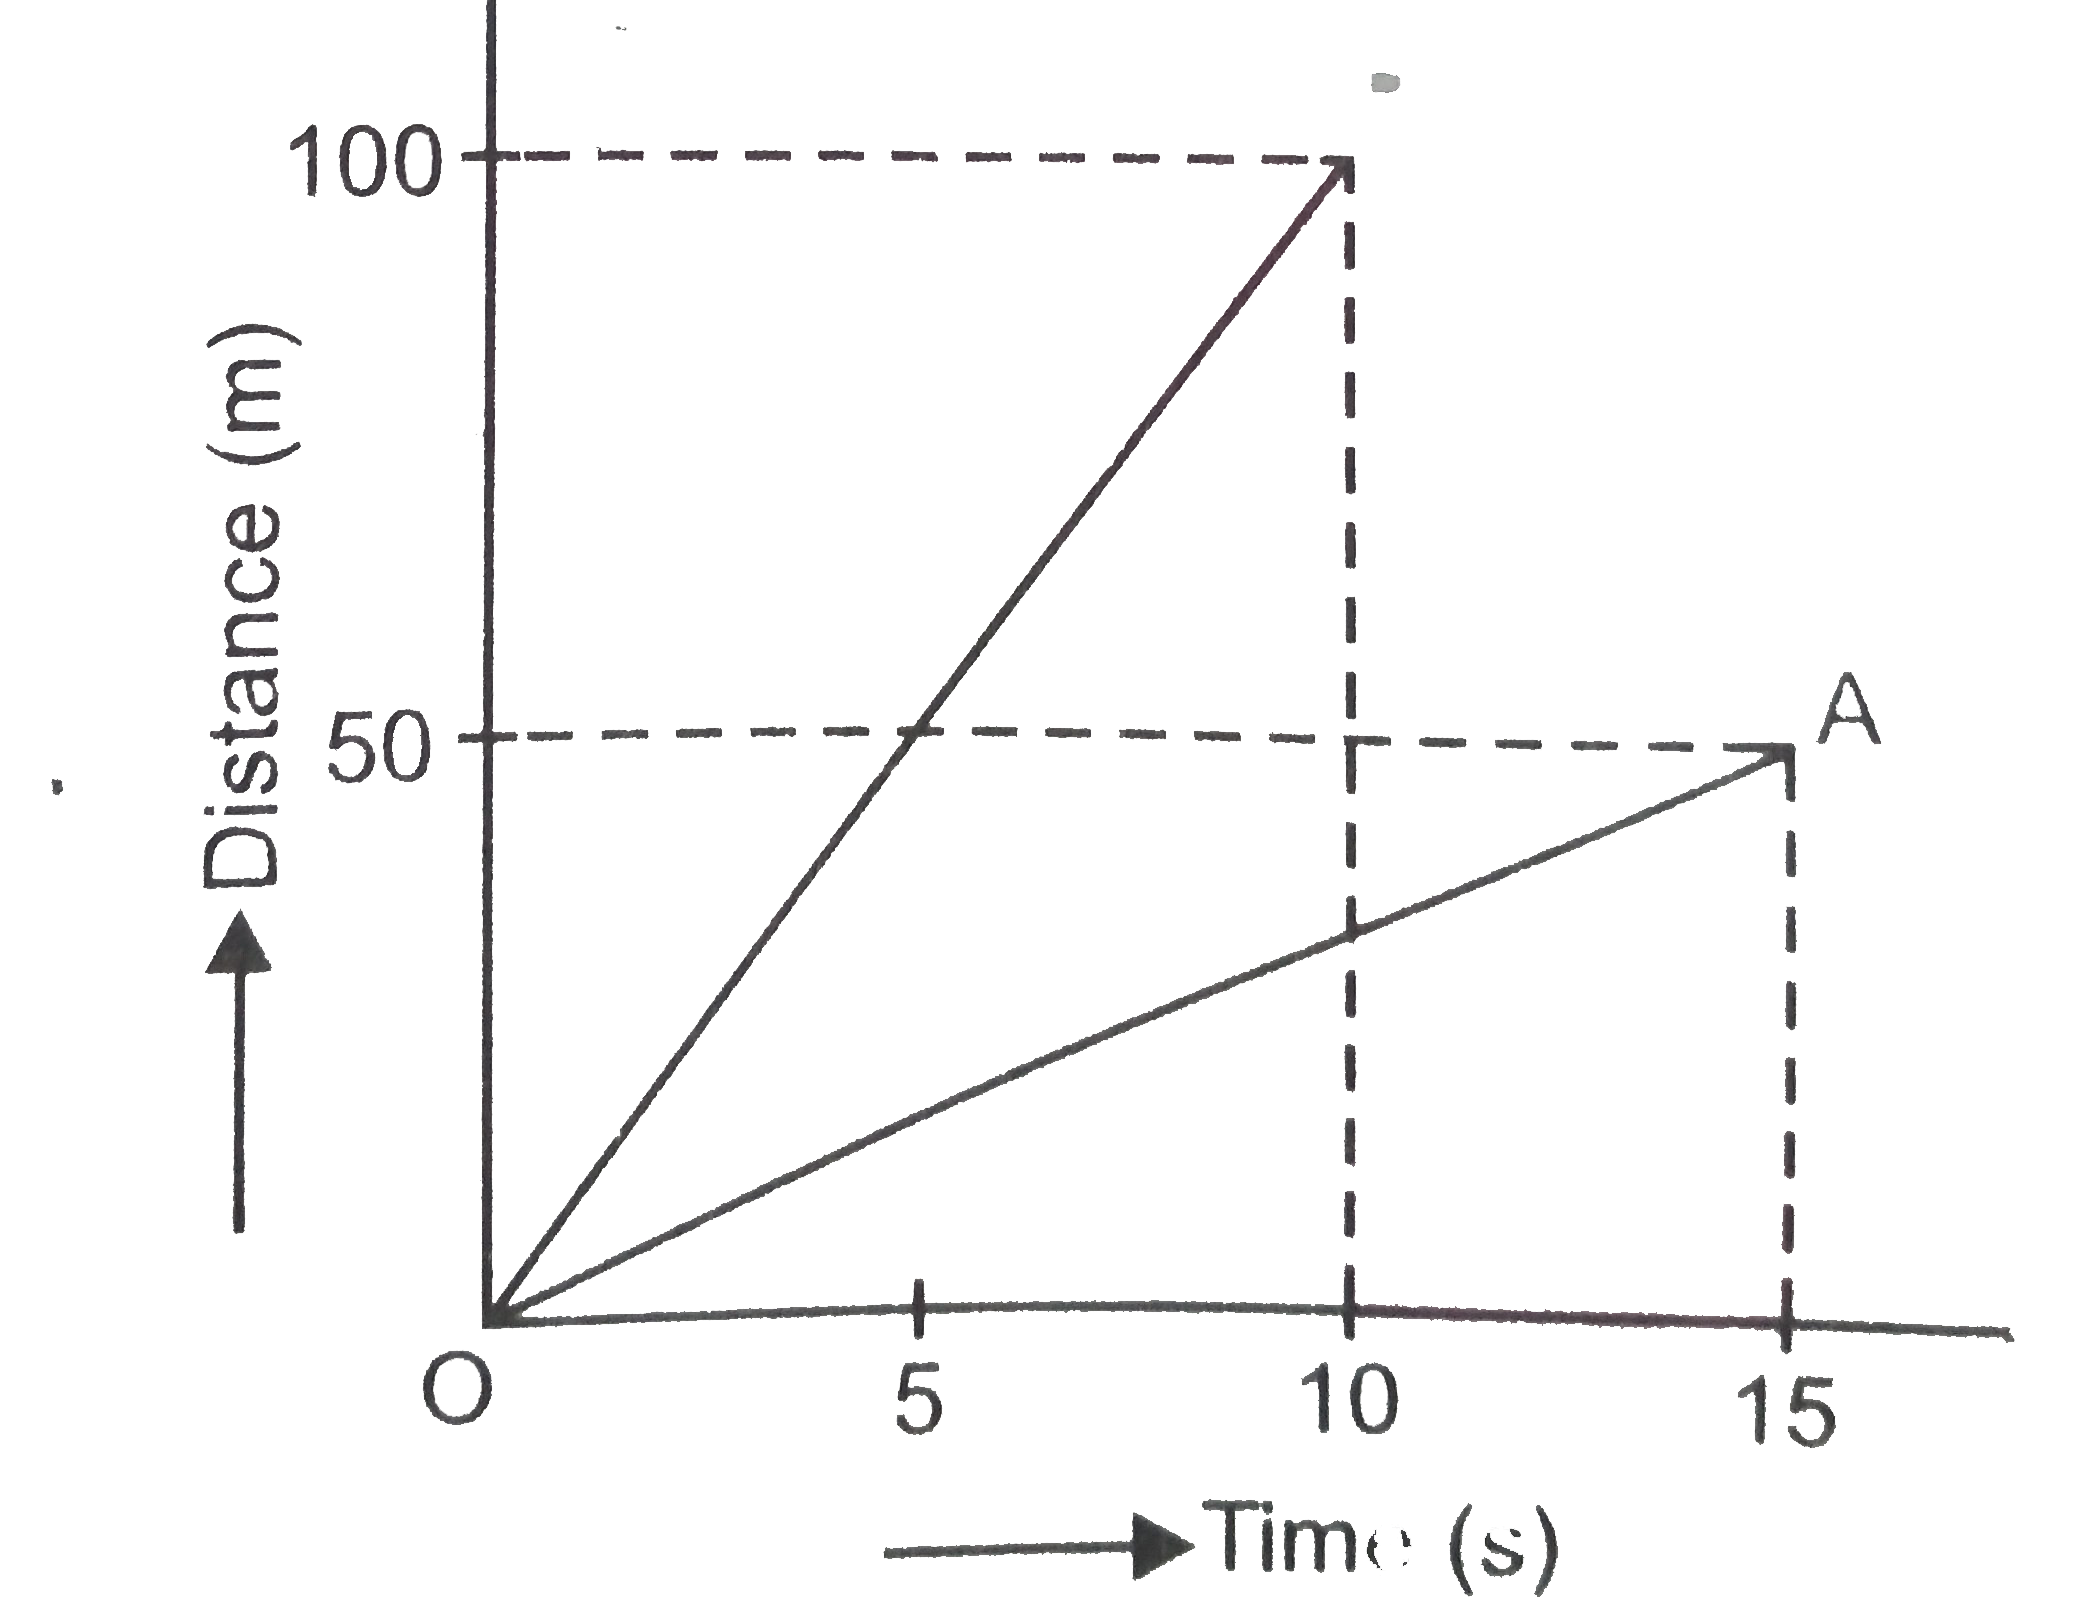
The ditance time graph of two bodies AandB are shown in Figure. Observer the graph carefully and answer the following questions :
(i) Do both the bodies start from the same position ?
(ii) Do they have uniform speed ?
(c ) Does anybody have acceleration ?
(iv) What is speed of A?
(v) What is speed of B ?
(vi) Without actual calculation, can you infer which body is travelling faster ?
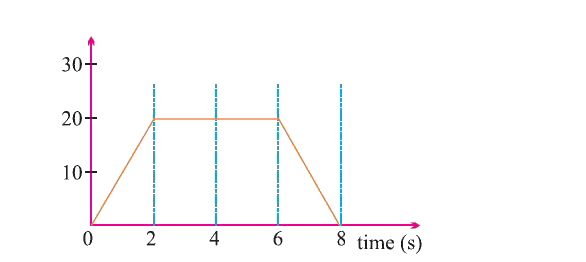
View SolutionThe velocity time graph for a particle is shown in figure. Draw acceleration time graph from it.
View Solution
Knowledge Check
The velocity - time graph of two bodies A and B is shown in figure. Choose correct statement.
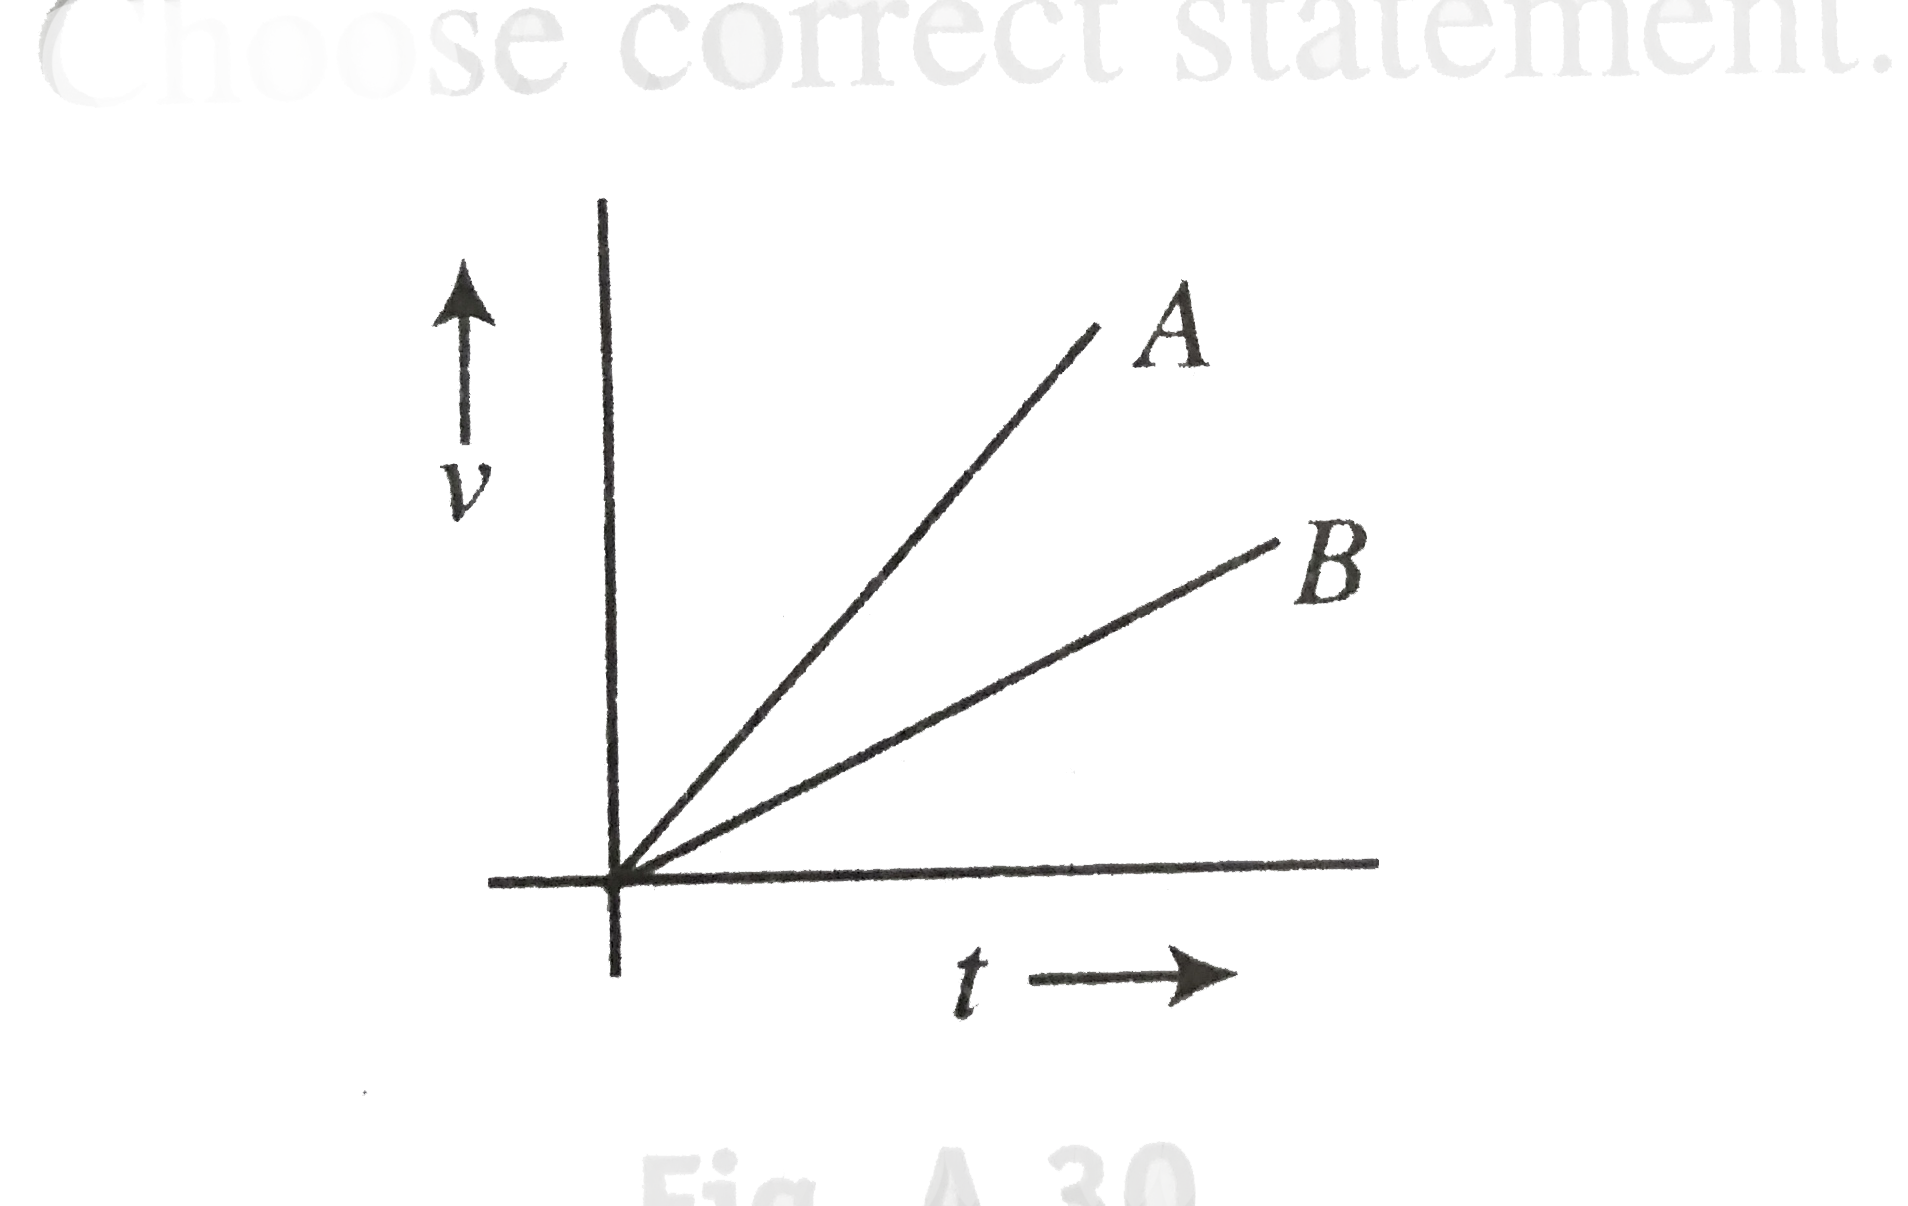 Aacceleration of Bgt acceleration of ABacceleration of A gt acceleration of BCboth are starting from same pointDA covers greater distance than B in the same time.
The velocity - time graph for two bodies A and B are shown in figure. Then, the acceleration of A and B are in the ratio
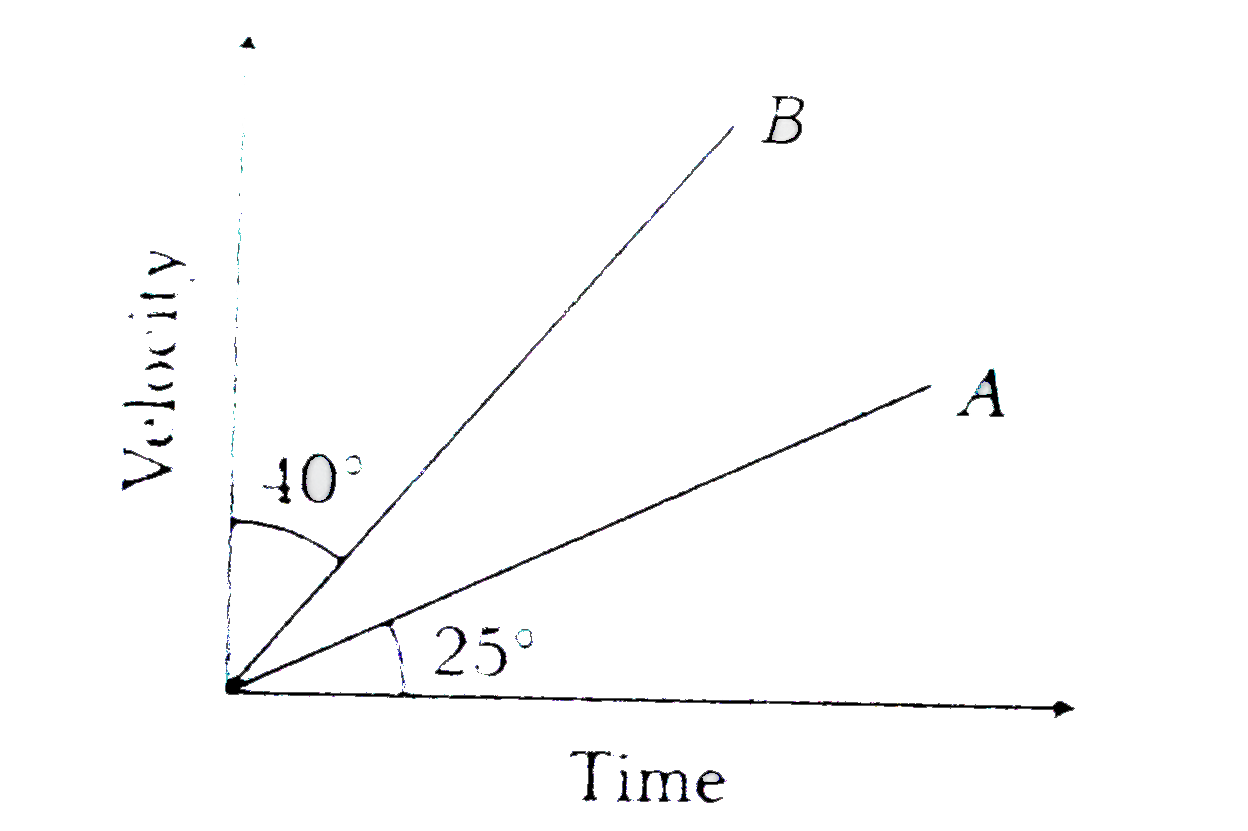 Asin25∘ to sin50∘Btan25∘ to tan40∘Ccos25∘ to cos50∘Dtan25∘ to tan50∘
The velocity-time graph of a body is shown in the figure, it implies that at point B
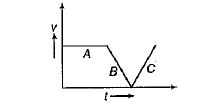 Athe force Is zeroBthere is a force toward motionCthere Is a force which opposes motionDthere is only gravitational force
If velocity-time graph of a body is as shown in figure, what is the nature of motion ?
View SolutionThe velocity time graph of a body is as showh in
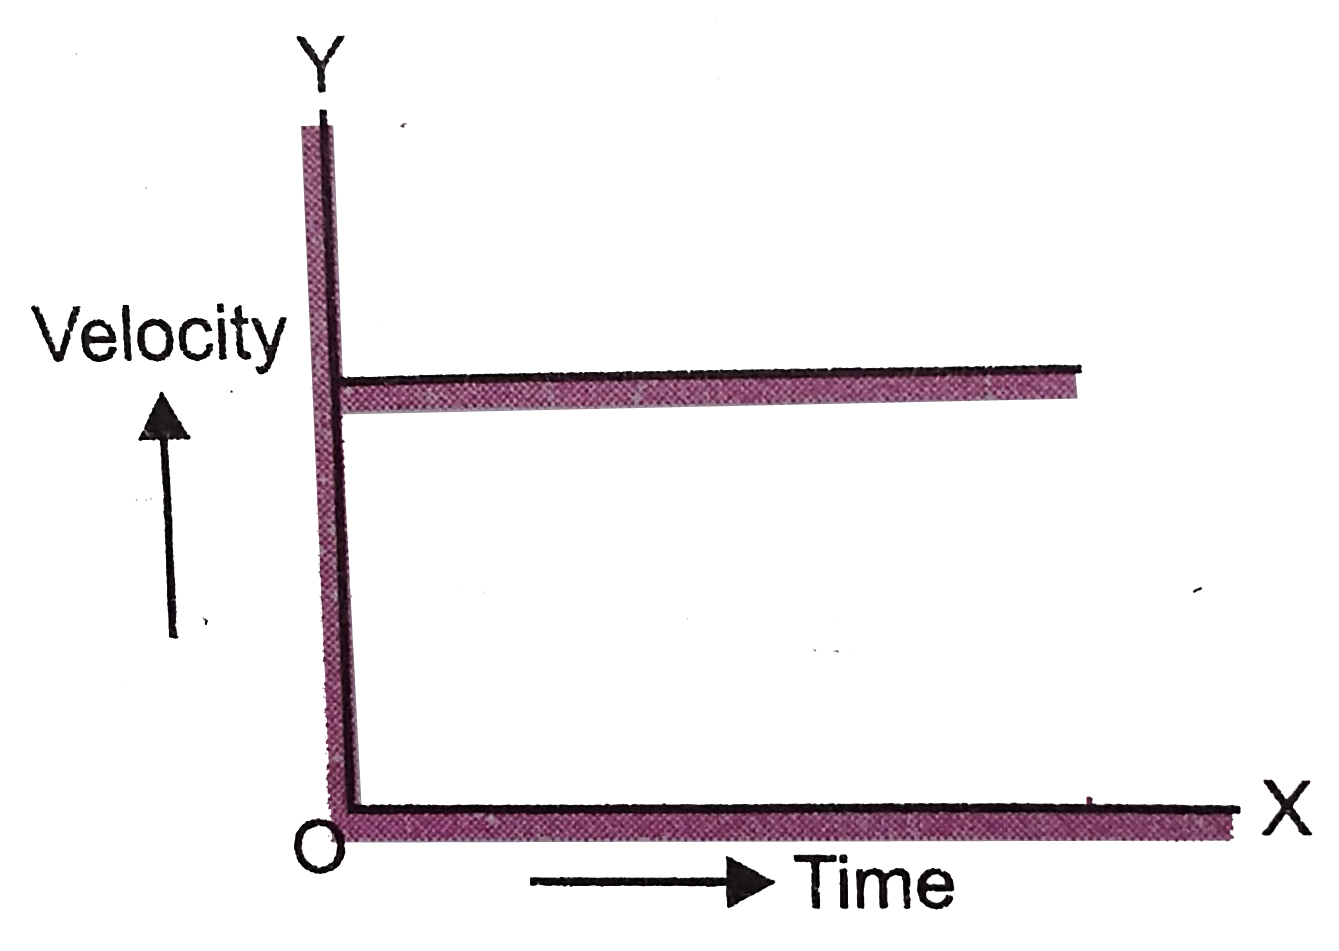
what would be the acceleration of the body ?
View SolutionStudy the speed-time graph of a car given alongside and answer the following questions :
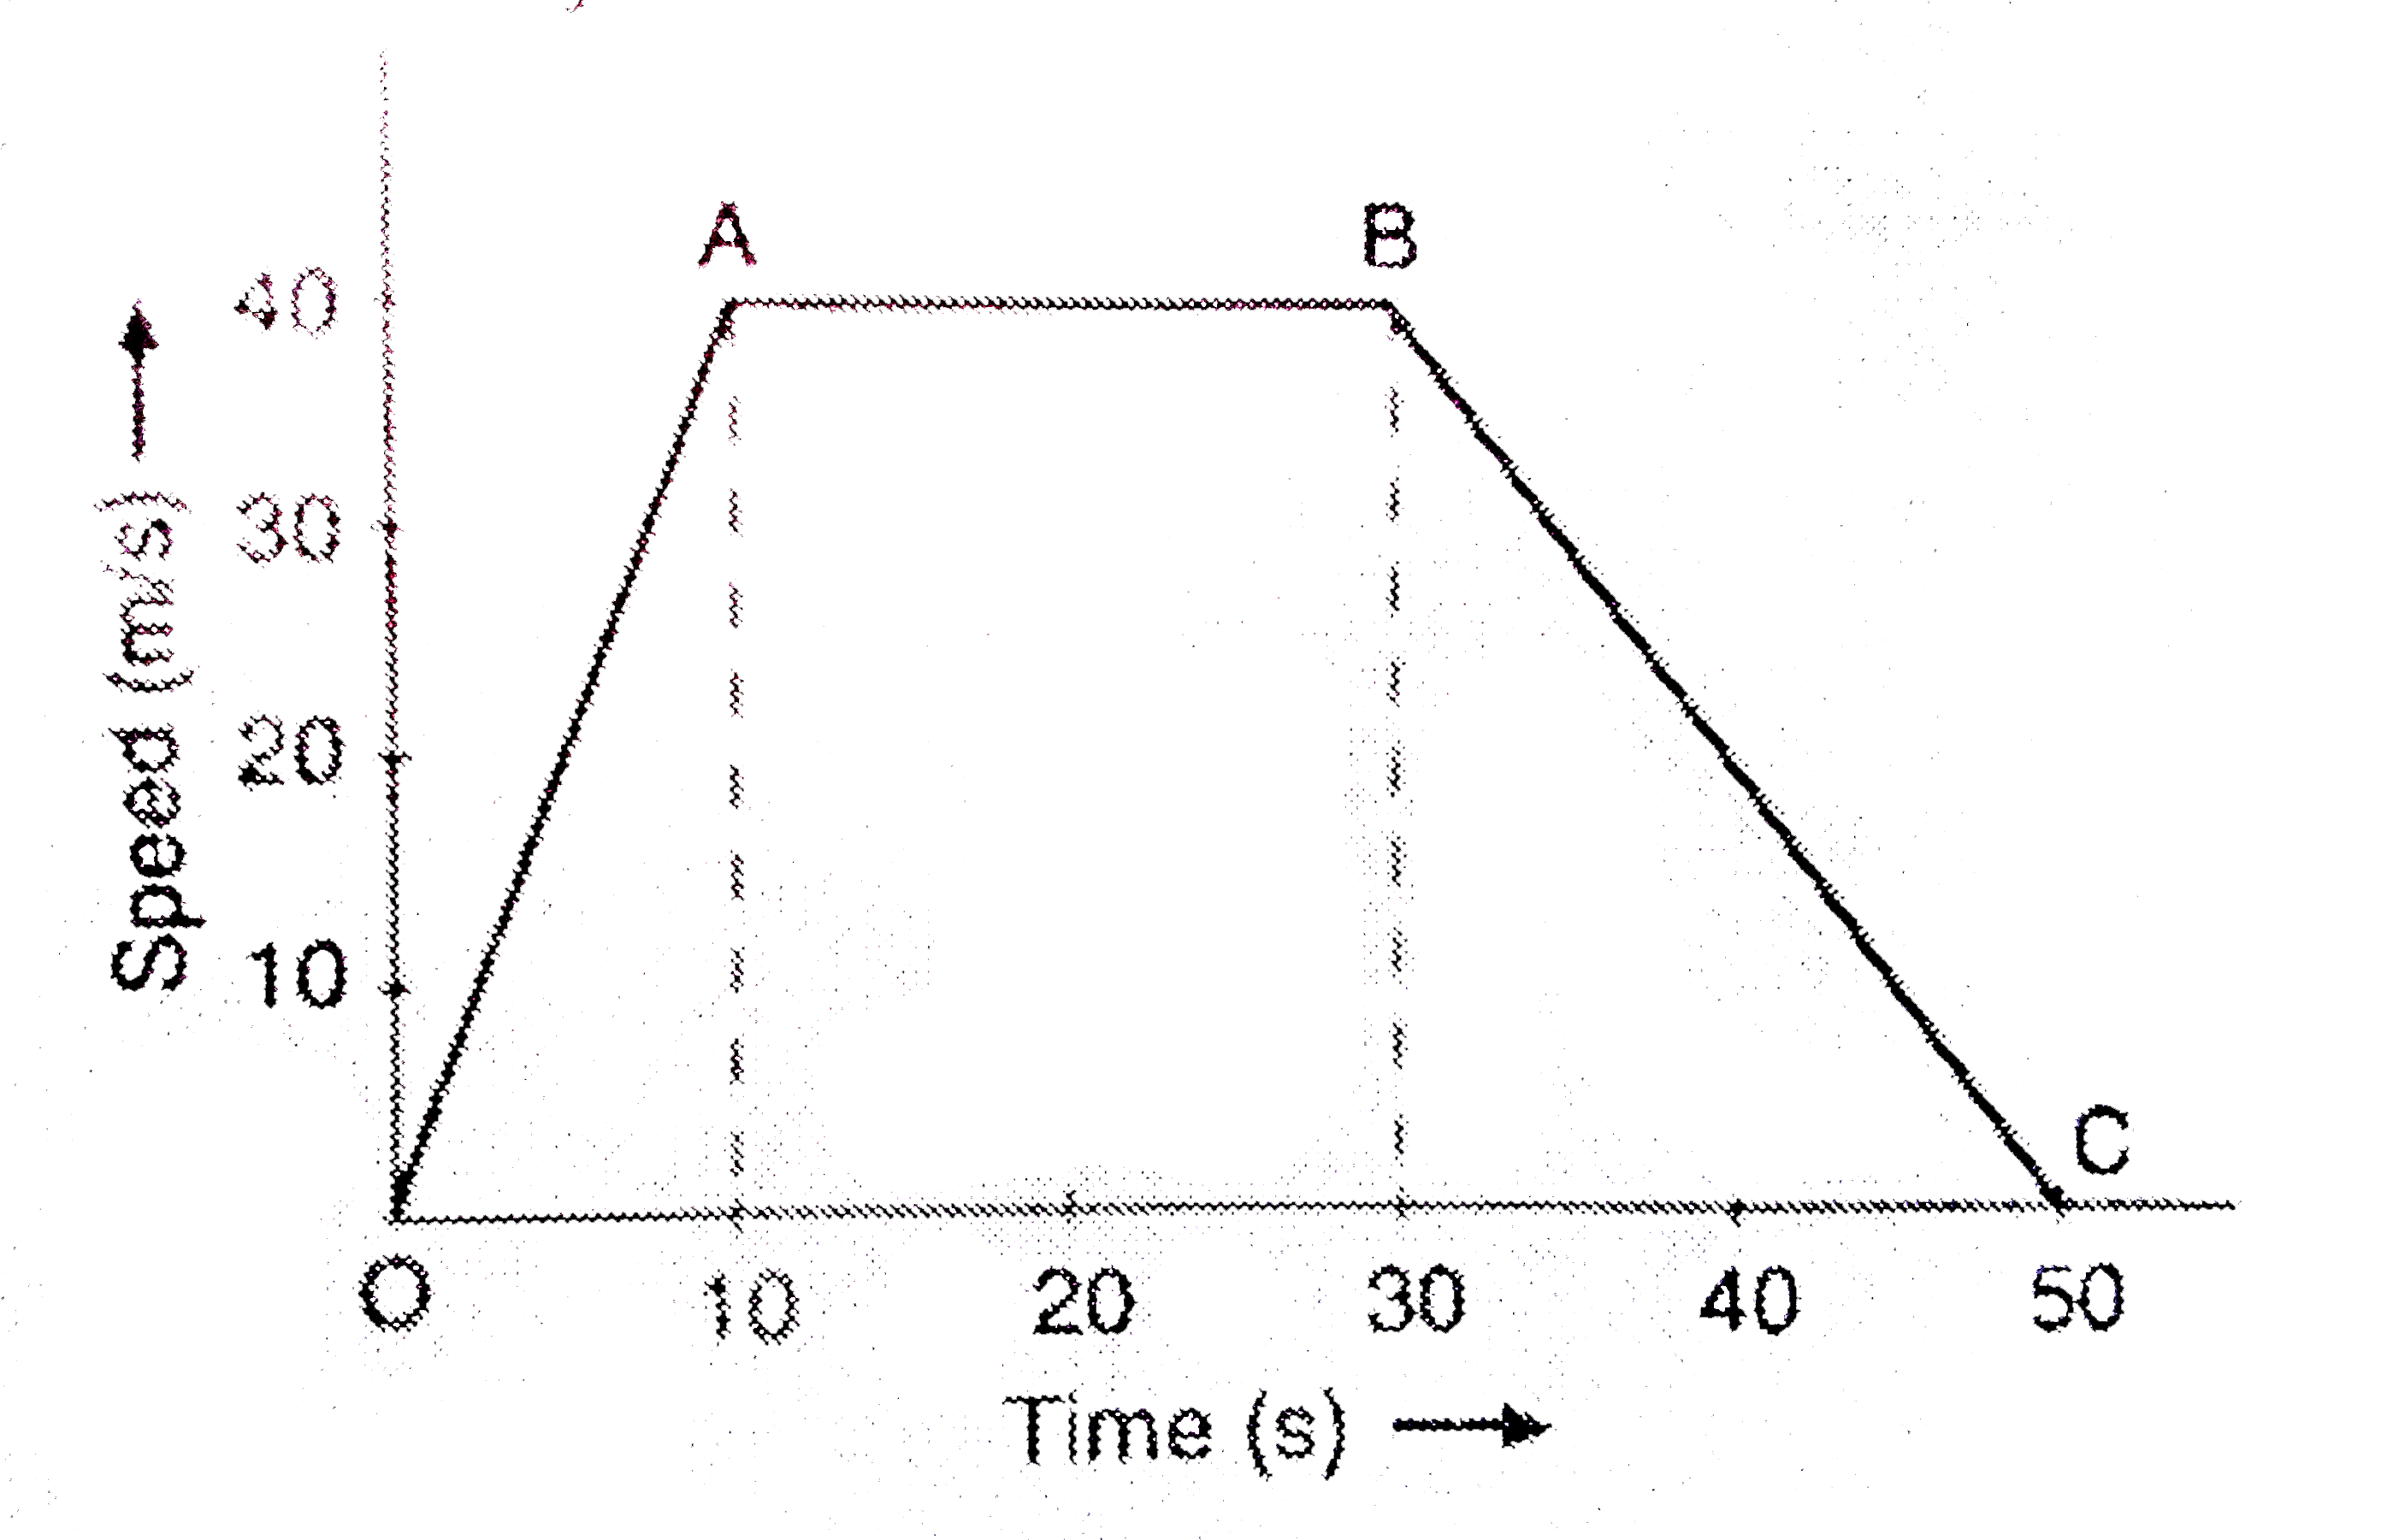
(i) What type of motion is represented by OA ?
(ii) What type of motion is represented by AB ?
(iii) What type of motion is represented by BC ?
(iv) What is the acceleration of car from O to A ?
(v) What is the acceleration of car from A to B ?
(vi) What is the retardation of car from B to C ?
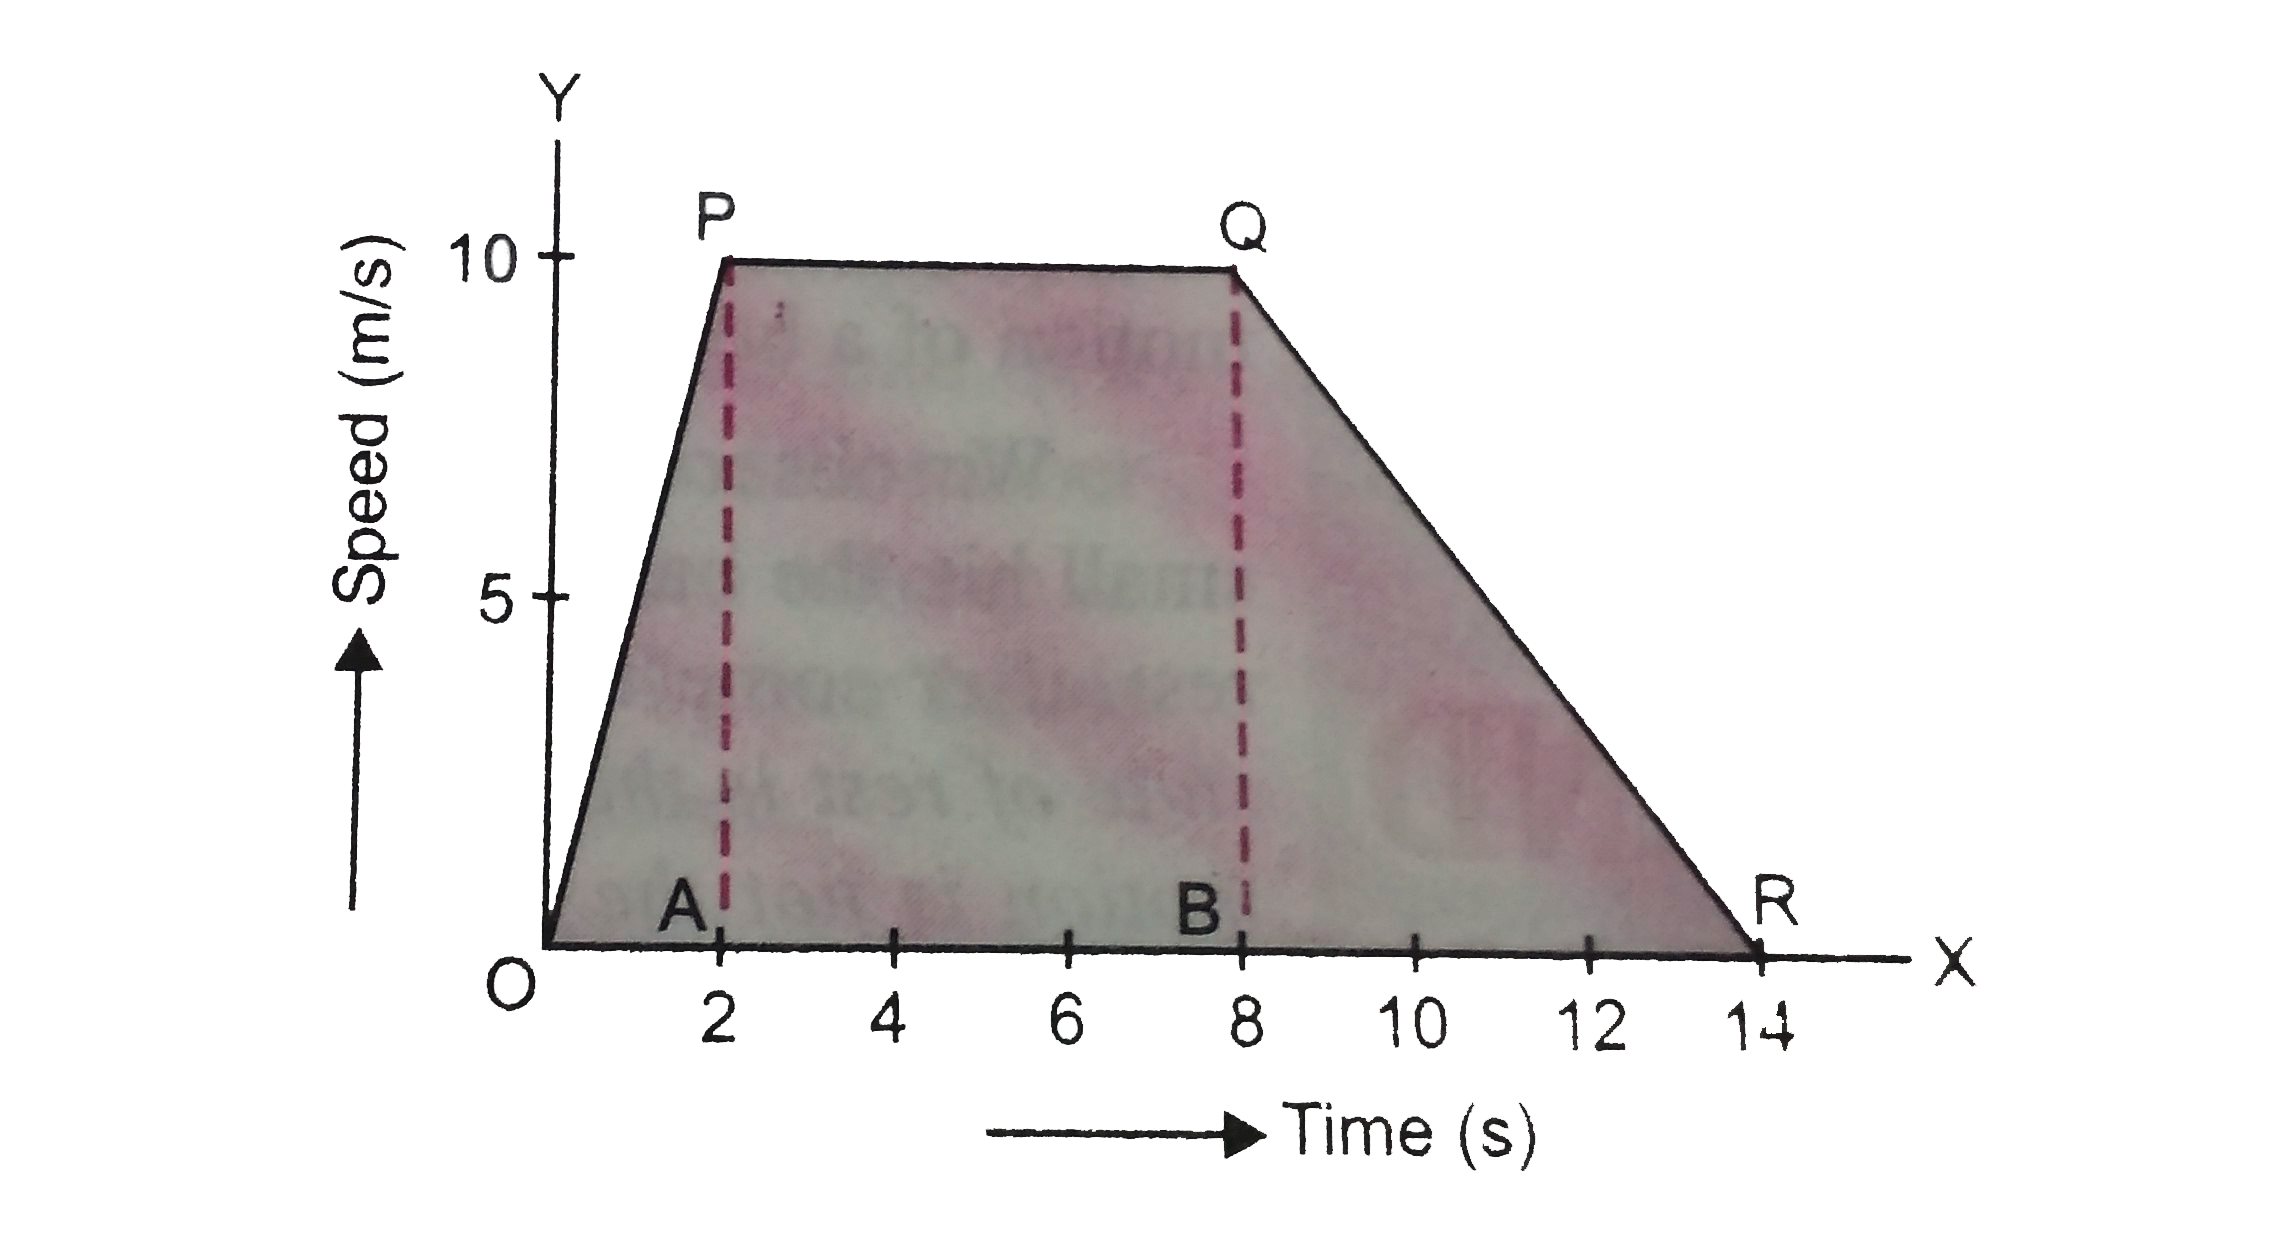
View SolutionThe speed time graph of a body is shown in Figure. Observer the graph carefully and answer the following :
(i) What kinds of motion are represented by OP,PQ and QR ?
(ii) Calculate acceleration of the body for the first 2sec.
(iii) Calculate retardation of body from 8s to 14s.
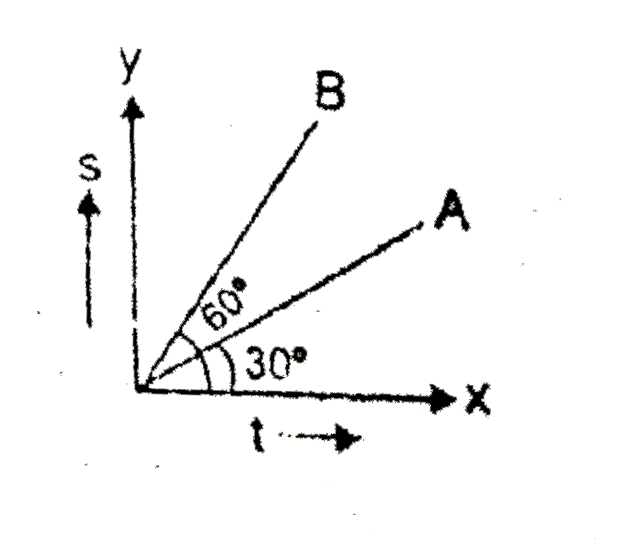
View SolutionThe displacement time graphs of two bodies A and B are shown in figure. The ratio of velocity of A to velocity of B,vA/vB is:
View Solution