A survey was conducted in Aadarsh Vidyalaya to know the inclination of students towards different subjects. The data obtained is presented by the adjacent pie diagram. If the total number of students was 500, answer the following question.
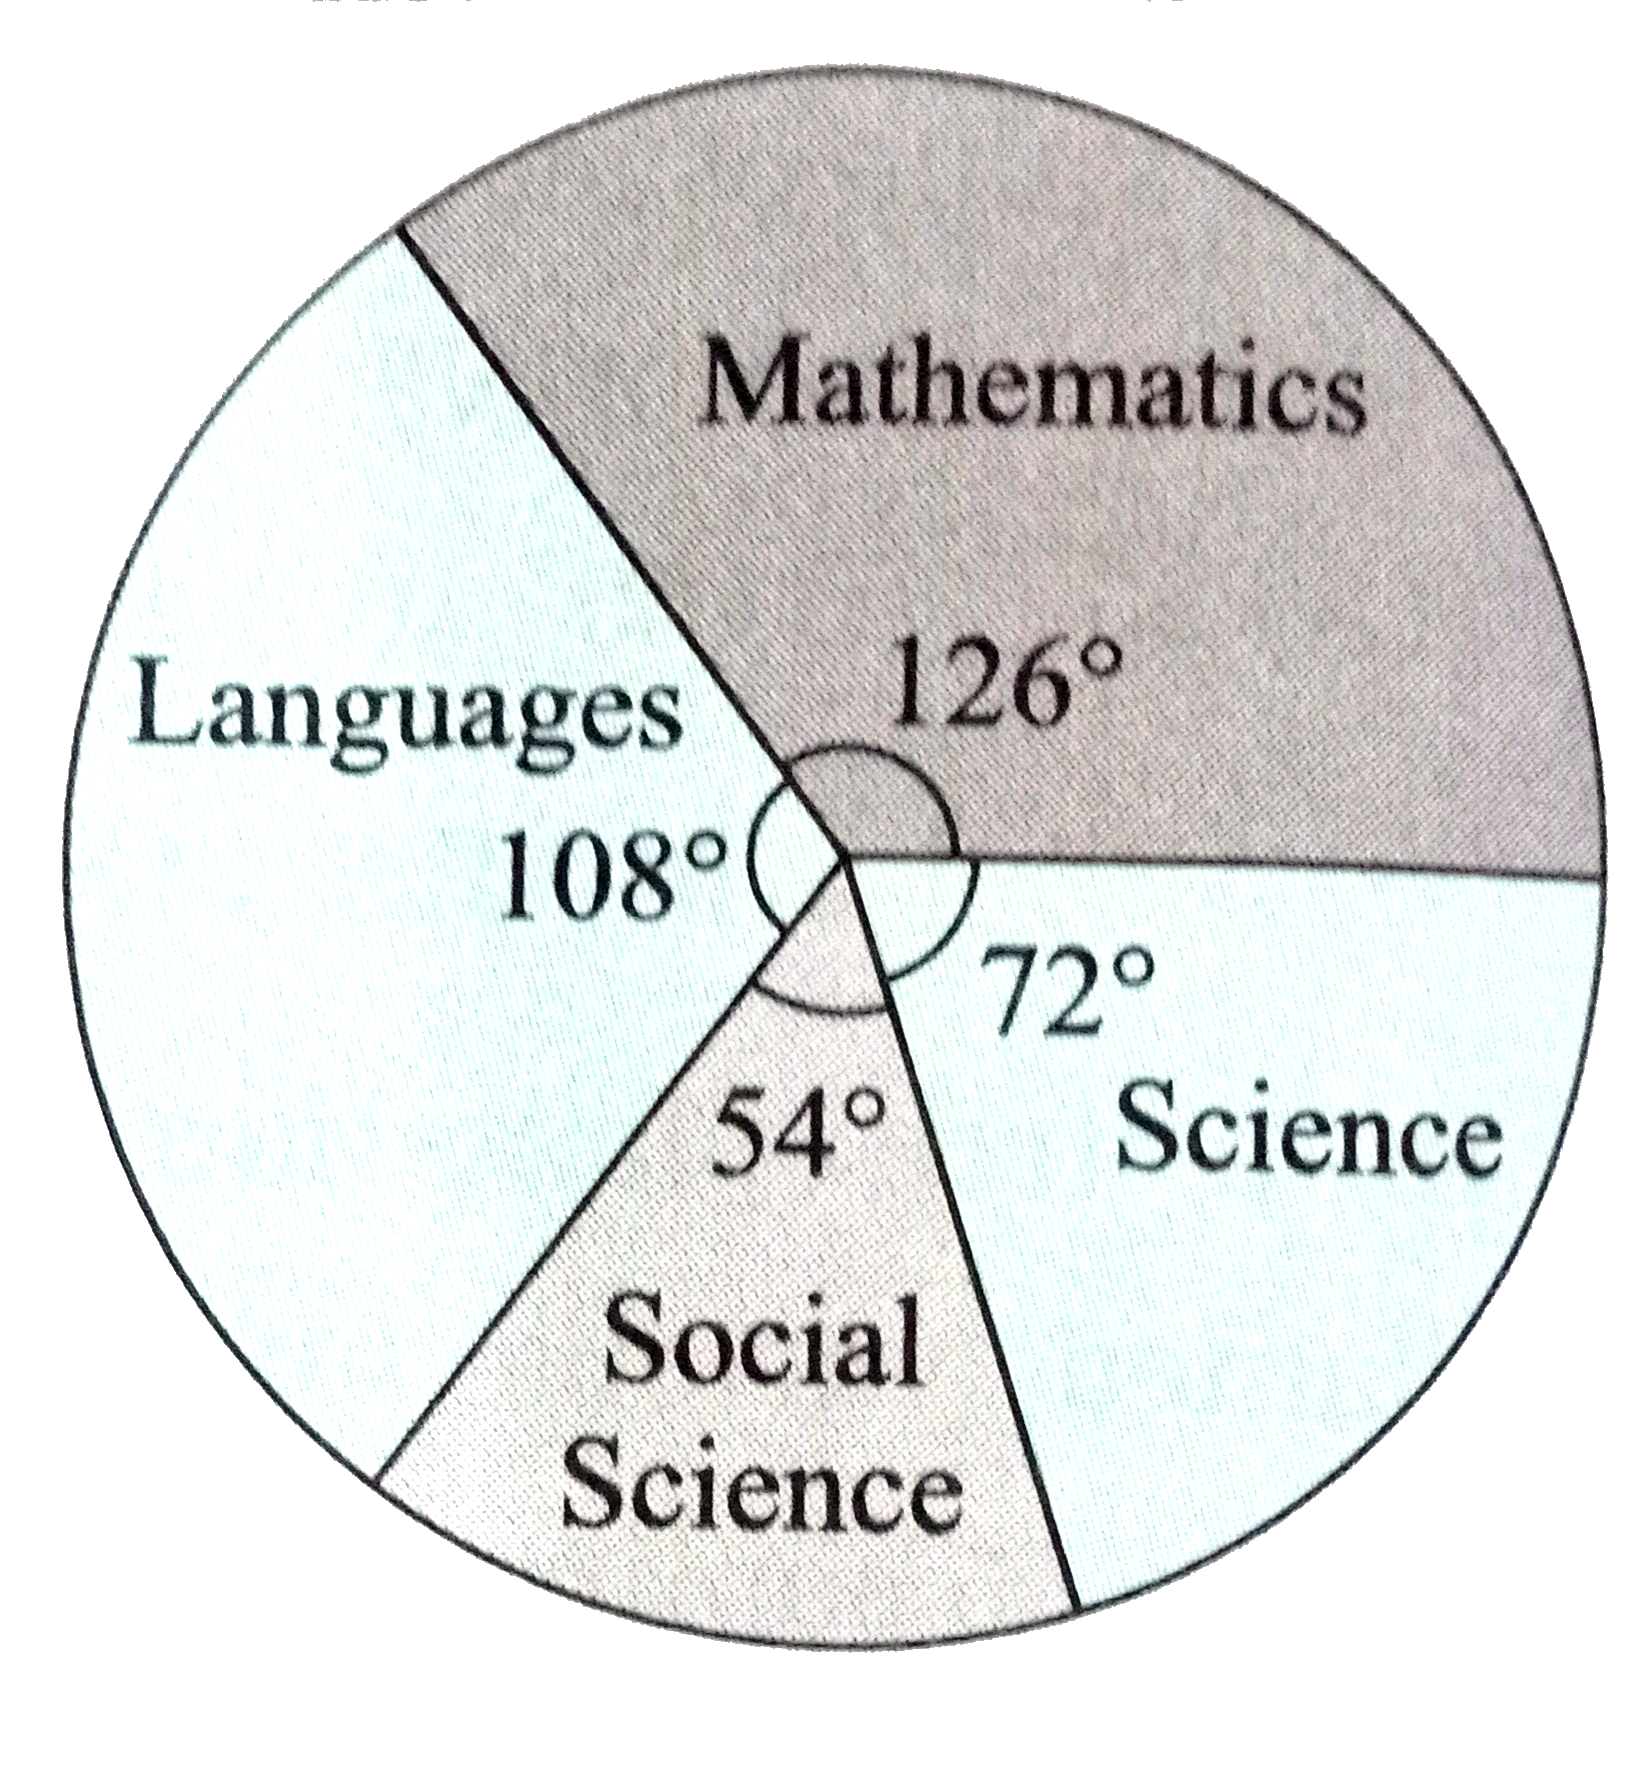
(i) How many students show inclination towards mathematics ?
(ii) How many students are inclined towards social science ?
(iii) How many more students are inclined towards languages than science ?
The correct Answer is:(i)175(ii)75(iii)50.
Step by step video & image solution for A survey was conducted in Aadarsh Vidyalaya to know the inclination of students towards different subjects. The data obtained is presented by the adjacent pie diagram. If the total number of students was 500, answer the following question. (i) How many students show inclination towards mathematics ? (ii) How many students are inclined towards social science ? (iii) How many more students are inclined towards languages than science ? by Maths experts to help you in doubts & scoring excellent marks in Class 10 exams.
Updated on:21/07/2023Topper's Solved these Questions
- STATISTICSBook:NAVNEET PUBLICATION - MAHARASHTRA BOARDChapter:STATISTICSExercise:Challenging Questions
Explore 2 Videos
- SIMILARITYBook:NAVNEET PUBLICATION - MAHARASHTRA BOARDChapter:SIMILARITYExercise:SUBJECTIVE TYPE
Explore 20 Videos
- THEOREMS Book:NAVNEET PUBLICATION - MAHARASHTRA BOARDChapter:THEOREMS Exercise:CIRCLE
Explore 15 Videos
Similar Questions
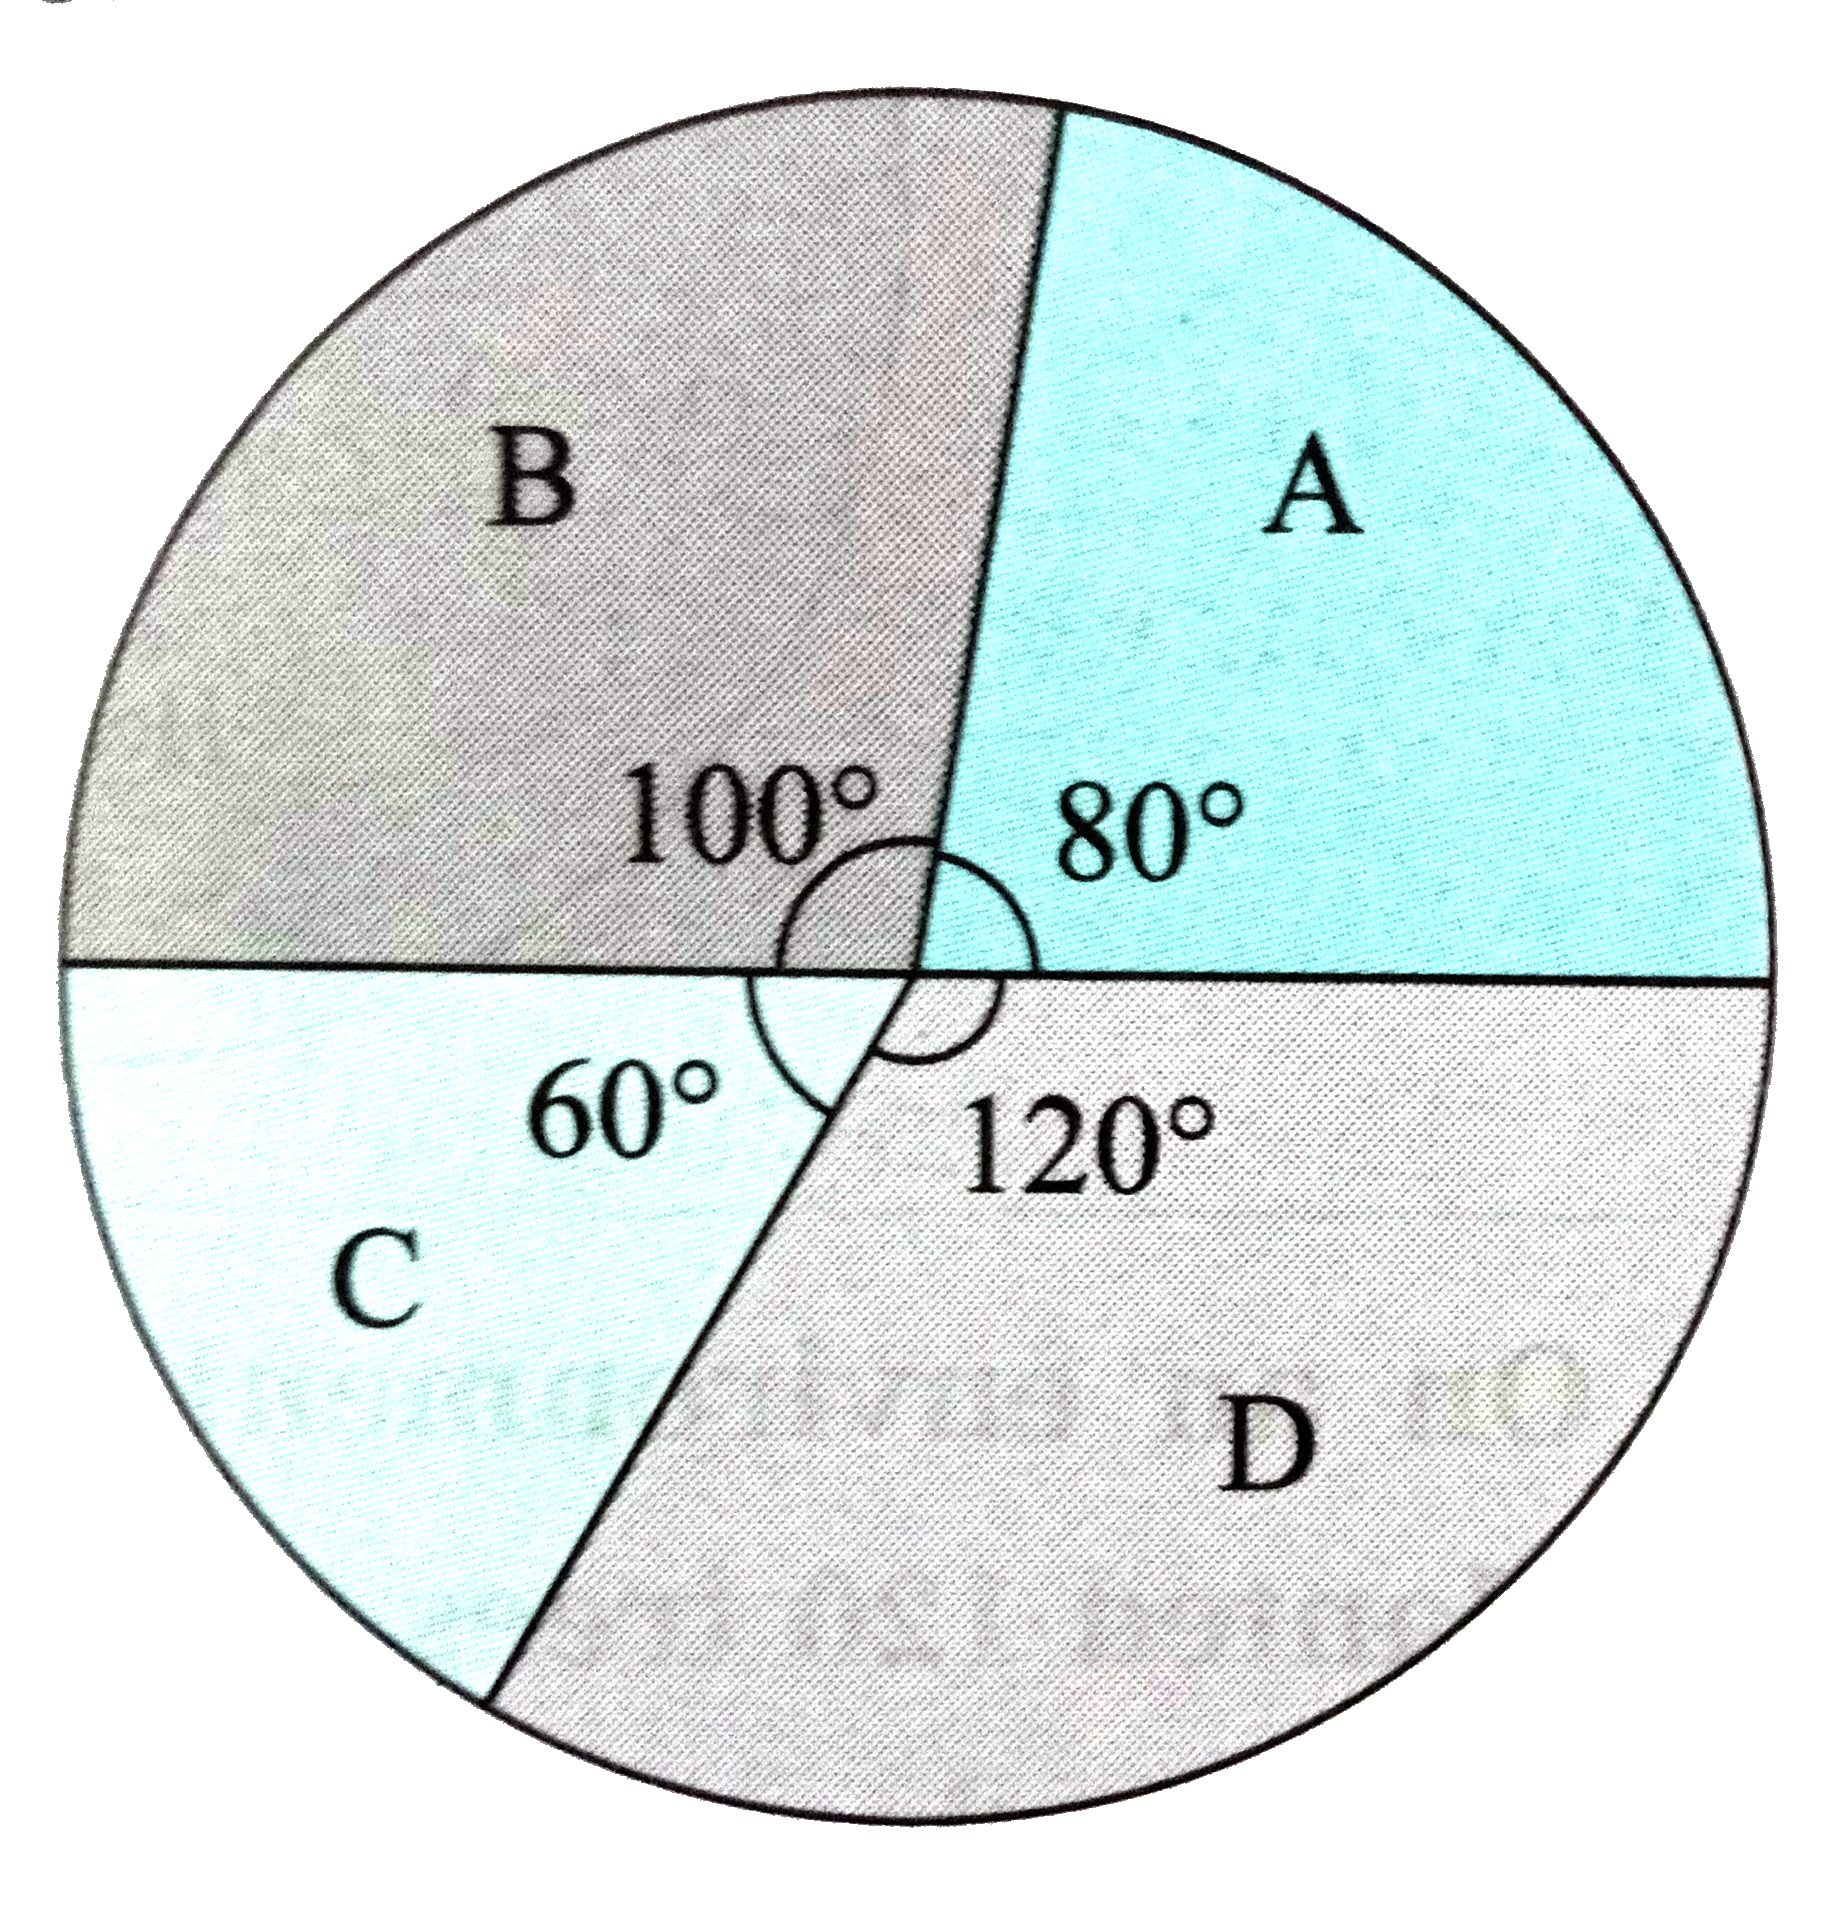
The pie diagram represents the number of valid votes secured by four students who contested for school captain.The total number of valid votes polled was 720.
Answer the following questions :
(i) Who has won the election ?
(ii) How many votes died the winner secure ?
(iii) What is the minimum number of votes ?Who got it ?
(iv) By how many votes did the winner defeat the nearest contestant ?
View SolutionThe heights of ΔABC and ΔDBC are 4 cm and 6 cm respectively. Find A(ΔABC)A(ΔDBC).
View SolutionTheorem:A line drawn through the end point of a radius and perpendicular to it is a tangent to the circle.
View SolutionHow many lines of symmetry does the above figure have ?
View SolutionDetermine the point of symmetry of a regular hexagon.
View SolutionMatch the following Column A to Column B

View SolutionMatch the following Column A to Column B

View SolutionMatch the following Column A to Column B

View SolutionThe inequation represented by the graph given below is :
View SolutionThe inequation that best describes the graph given below is _________
View SolutionThe inequation that best describes the following graph is _________
View SolutionA survey of students was made to know which game they like. The data obtained in the survey is presented in the following pie diagram. If the total number of students are 1000,
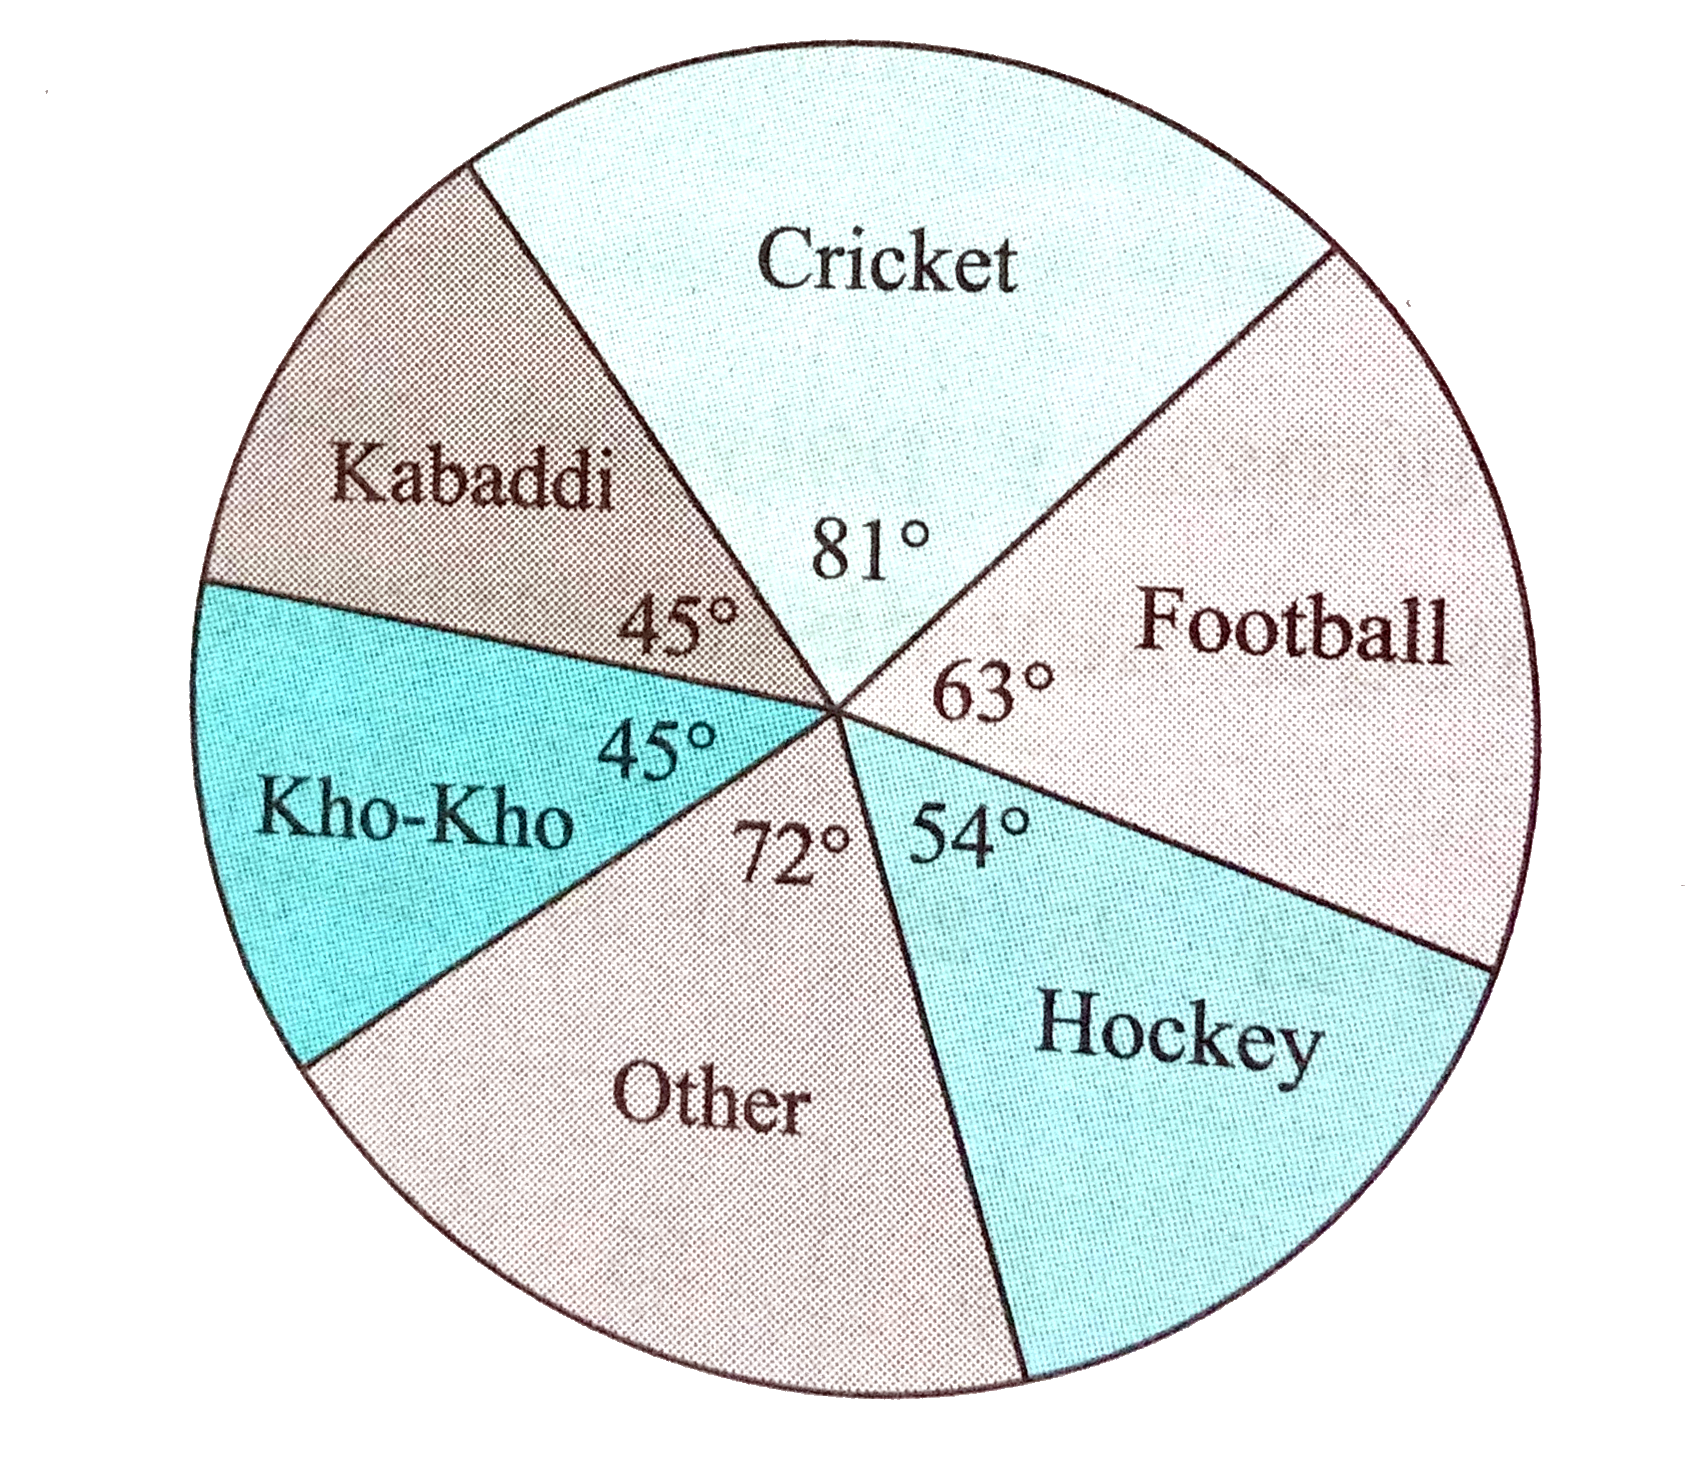
(1) how many students like cricket ?
(2) how many studetns like football ?
(3) how many students prefer other games ?
View SolutionA survey of students was made to know which game they like. The date obtained in the survey is presented in the below pie diagram. If the total number of students are 1000
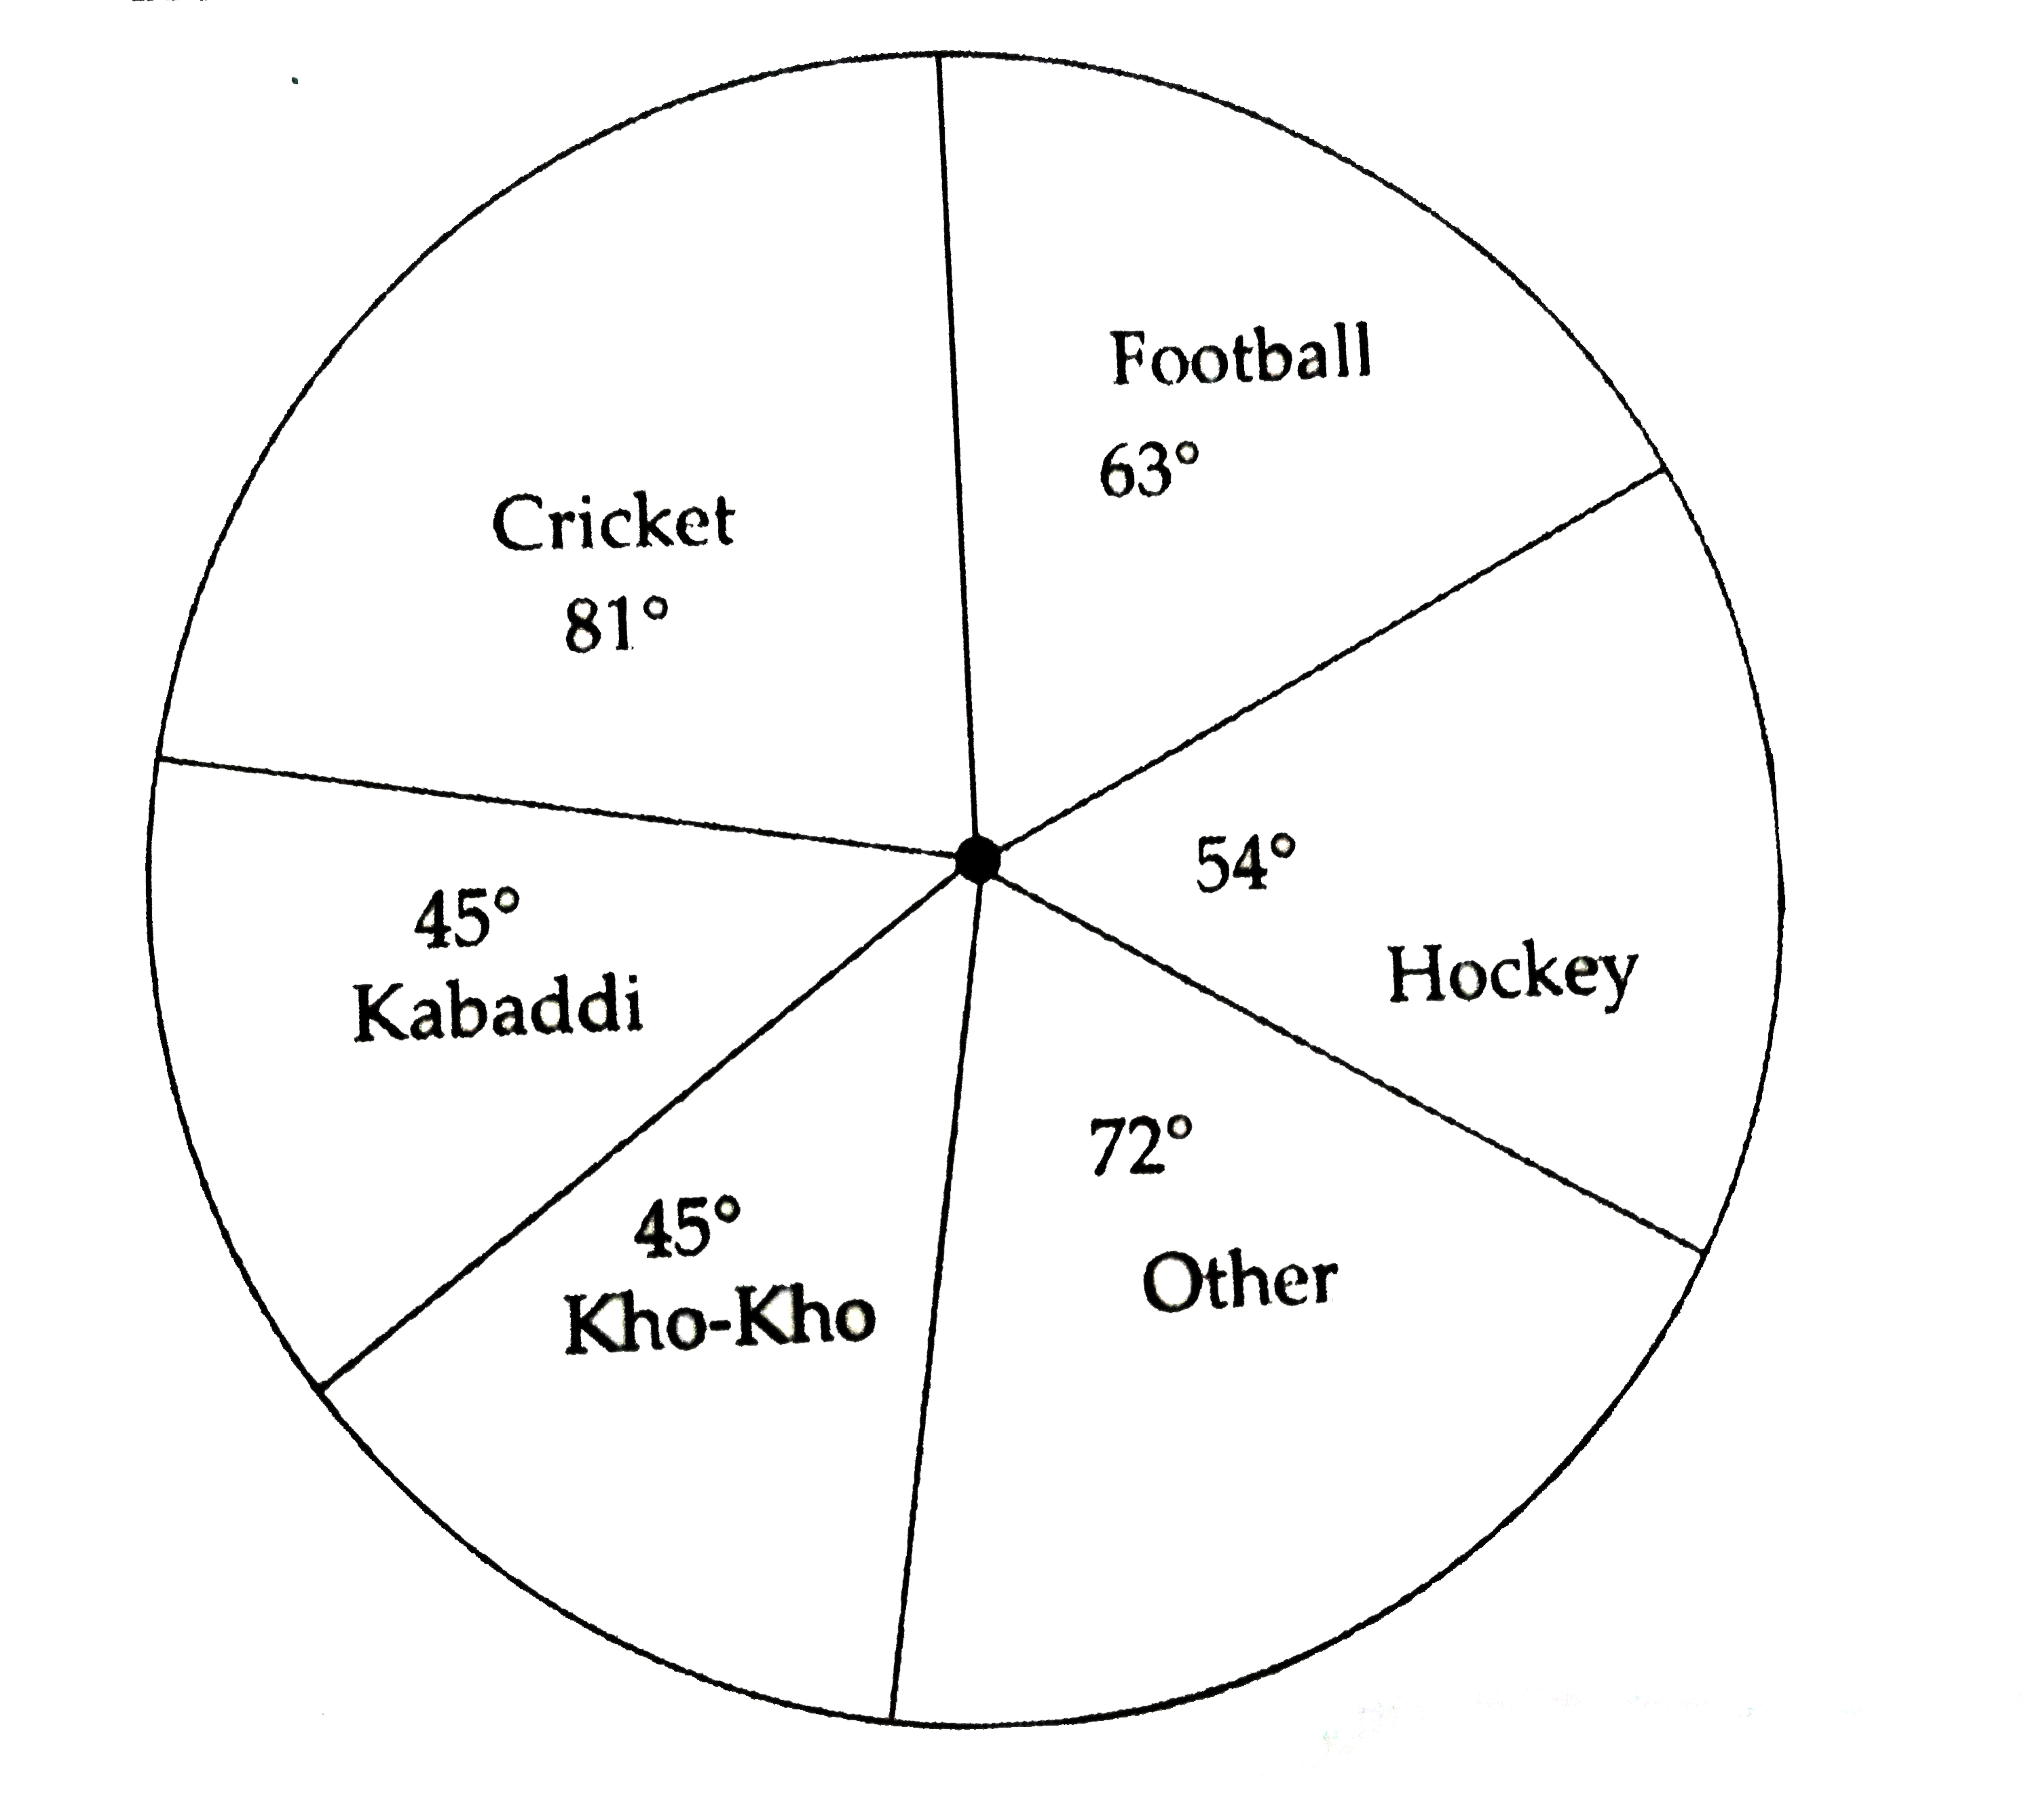
(i)How many students like cricket ?
View SolutionA survey of students was made to know which game they like. The date obtained in the survey is presented in the below pie diagram. If the total number of students are 1000

(ii) How many students like football ?
View SolutionA survey of students was made to know which game they like. The date obtained in the survey is presented in the below pie diagram. If the total number of students are 1000
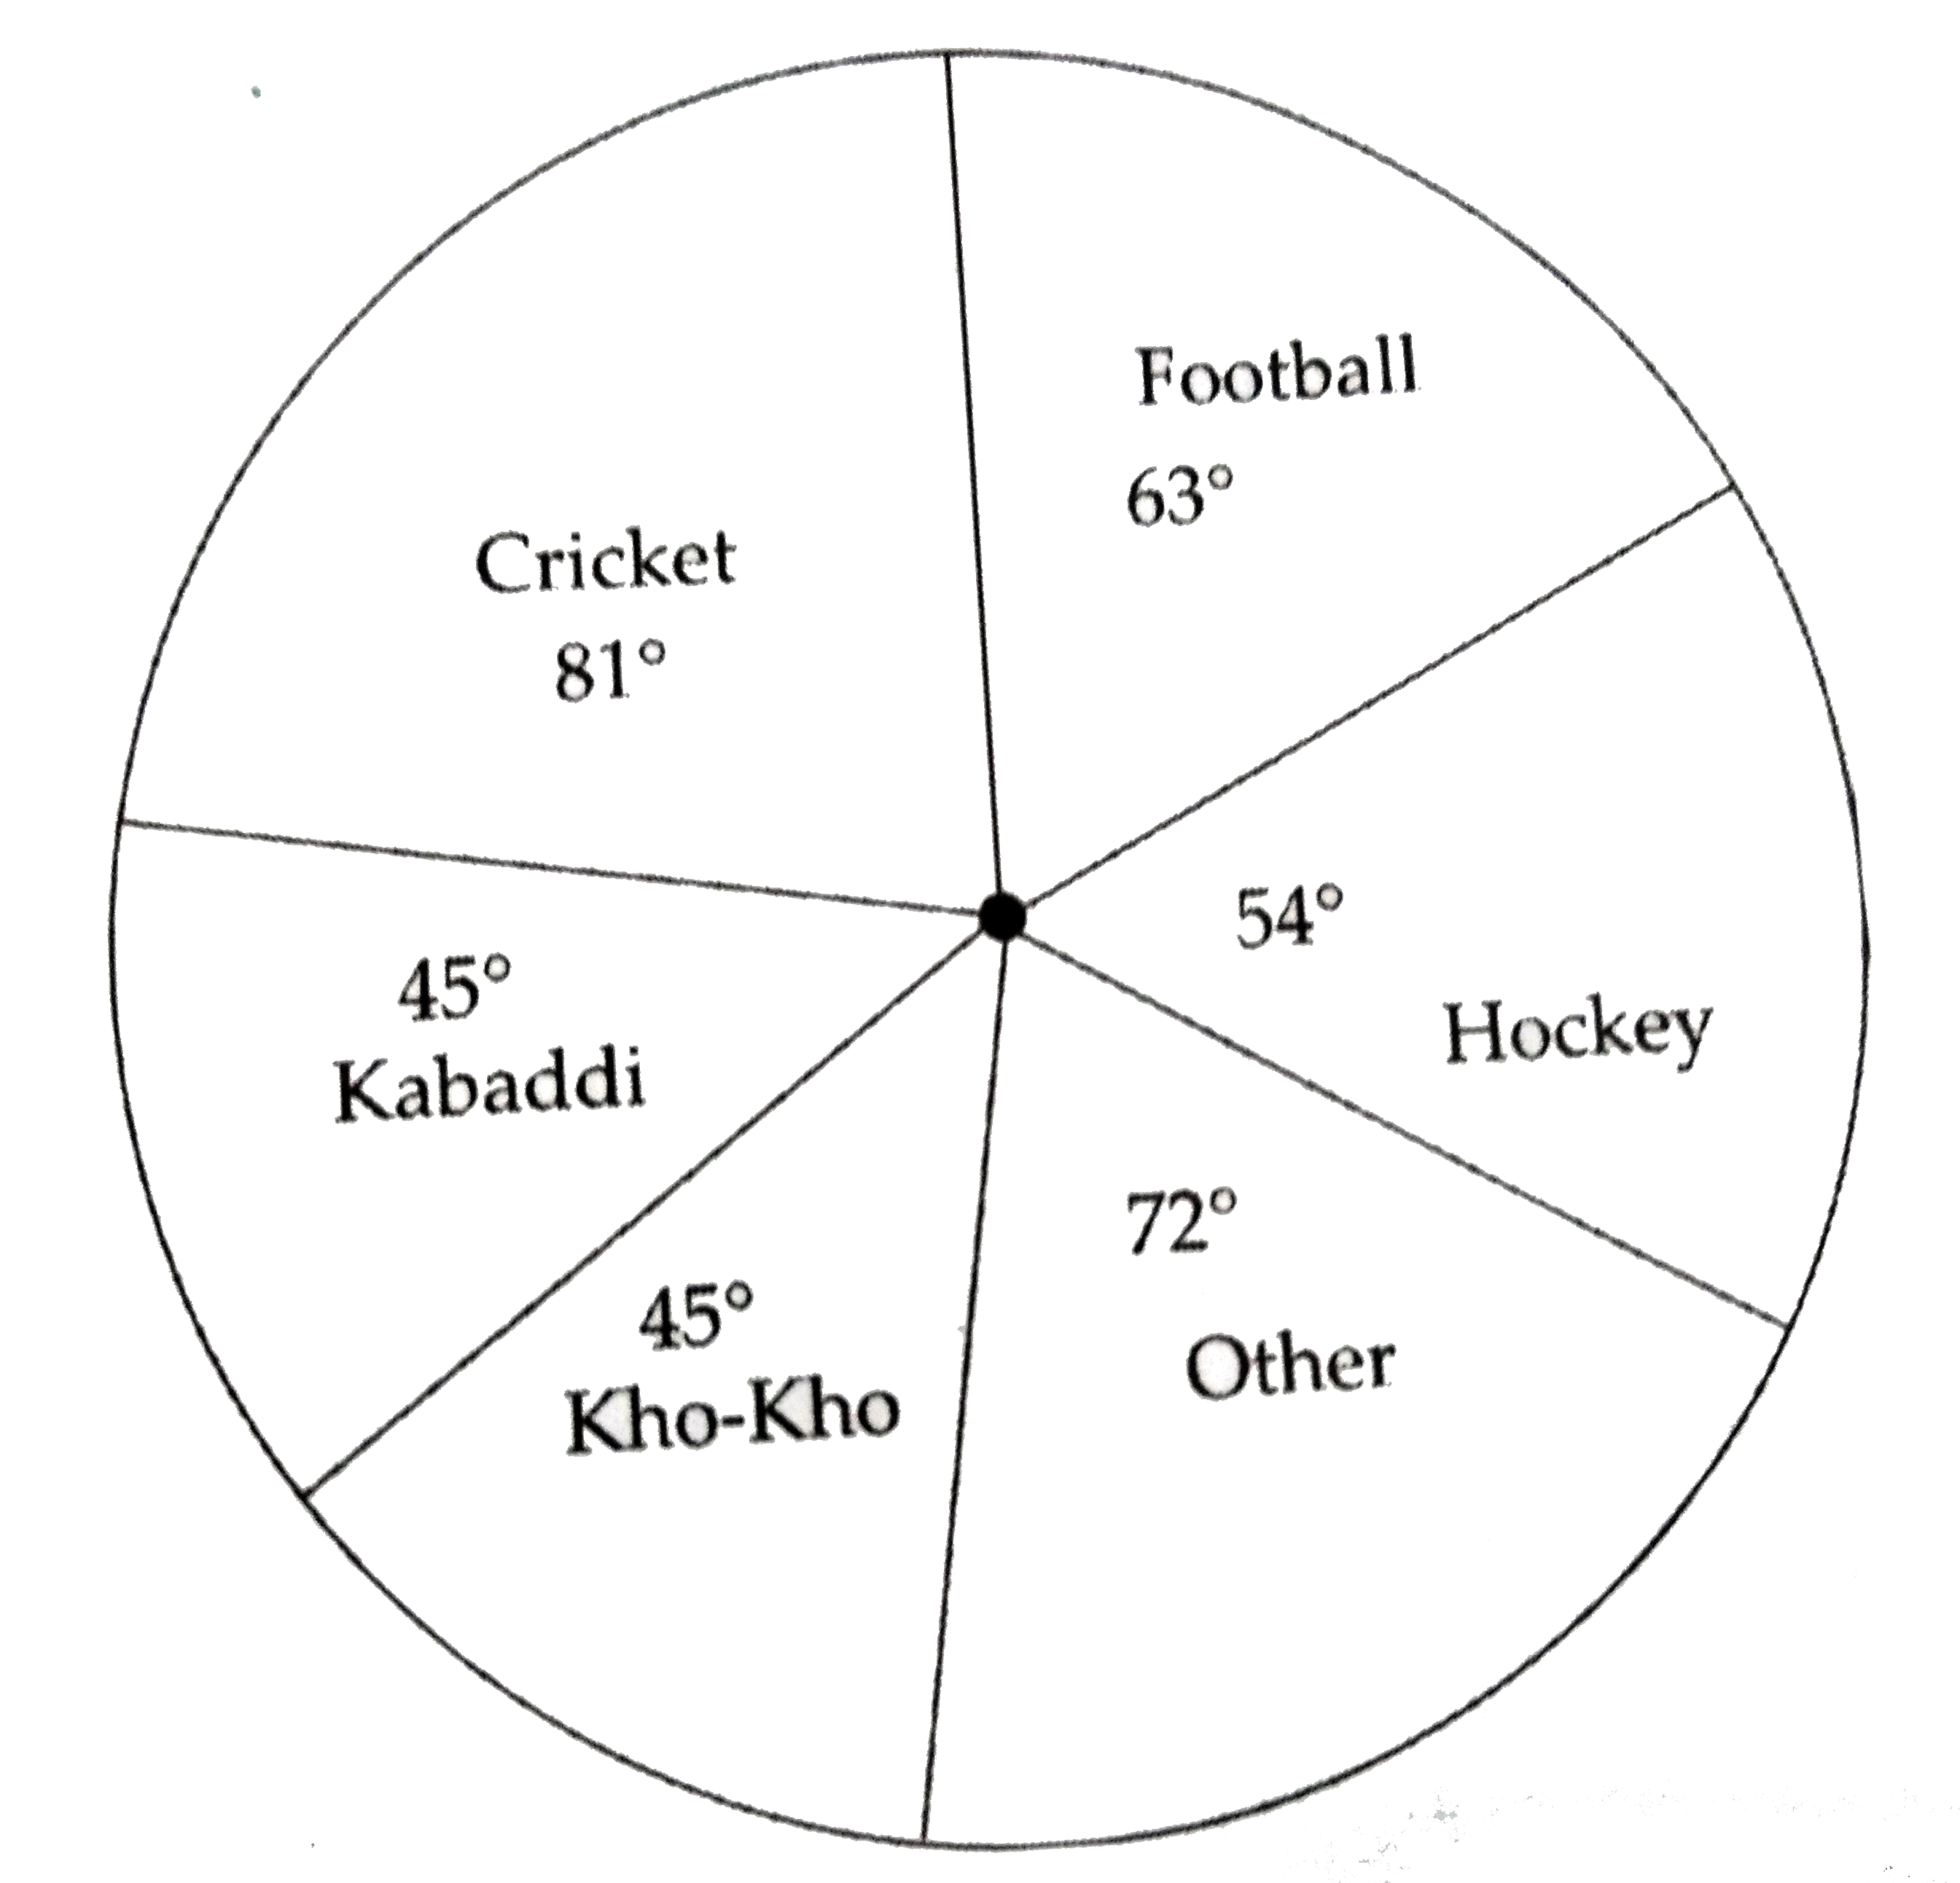
(iii) How many students prefer other games?
View Solution