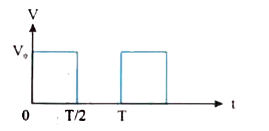
The r.m.s. value of potential difference V shown in Fig. is

V0
V0/2
V0/√2
V0/√3
The correct Answer is:C
From graph we note that in time interval 0 to T/2 the potential diff. =V0 (constant) and in time interval T2 to T, the potential difference = 0.
∴Vrms=√V20×T2×02×T/2T=V0√2
Topper's Solved these Questions
- ELECTROMAGNETIC INDUCTION & ALTERNATING CURRENTBOOK - PRADEEPCHAPTER - ELECTROMAGNETIC INDUCTION & ALTERNATING CURRENTEXERCISE - Multiple Choice Questions
1 Video
- ELECTROMAGNETIC INDUCTION & ALTERNATING CURRENTBOOK - PRADEEPCHAPTER - ELECTROMAGNETIC INDUCTION & ALTERNATING CURRENTEXERCISE - Exercise
376 Videos
- DUAL NATURE OF RADIATION AND MATTERBOOK - PRADEEPCHAPTER - DUAL NATURE OF RADIATION AND MATTEREXERCISE - Exercise
191 Videos
- ELECTROMAGNETIC WAVESBOOK - PRADEEPCHAPTER - ELECTROMAGNETIC WAVESEXERCISE - II Focus multiple choice question
5 Videos
Similar Questions
Knowledge Check
The r.m.s. value of potential difference V shown in the figure is :
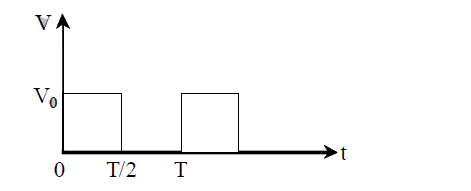 AV0/√3BV0CV0/√2DV0/2
The rms value of potential difference V shown in the figure is
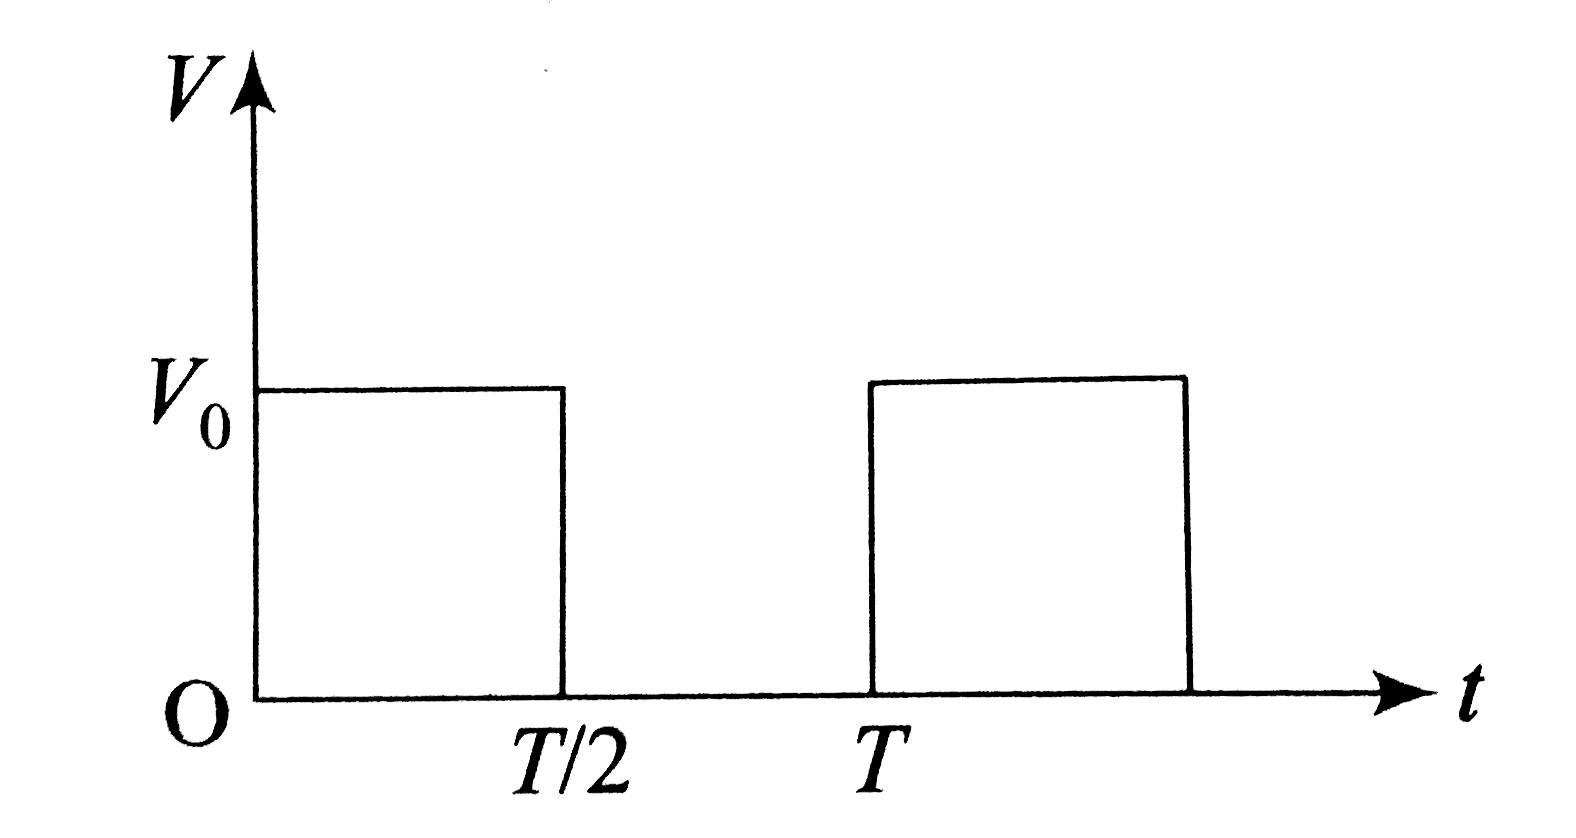 AV0BV0√2CV02DV0√3
The circuit shown in the figure is a series LCR circuit connected to an AC source. This circuit has many important applications in practical electronic systems. In the given circuit, L=20mH and frequency of applied alternating potential difference is ω=8000rad/s. Initial phase of applied potential difference has such a minimum value that initial value of instantaneous potential difference is half of is peak value while initial phase of current in the circuit has such a minimum value that initial value of instantaneous current equals its peak value. We also observe that current in the circuit leads the net voltage across the circuit. It is given that peak values of potential difference across R and L are I VR(peak))=25V
V(L)peak=20V

Impedance of the circuit isA60.4VB51.8VC44.8VD36.2V
A part of a complete circuit is shown in the figure . At some instant the value of current I is 1 A and it is decreasing at a rate of 102As−1 . The value of the potential difference VP−VQ, (in volts) at that instant , is ____________.

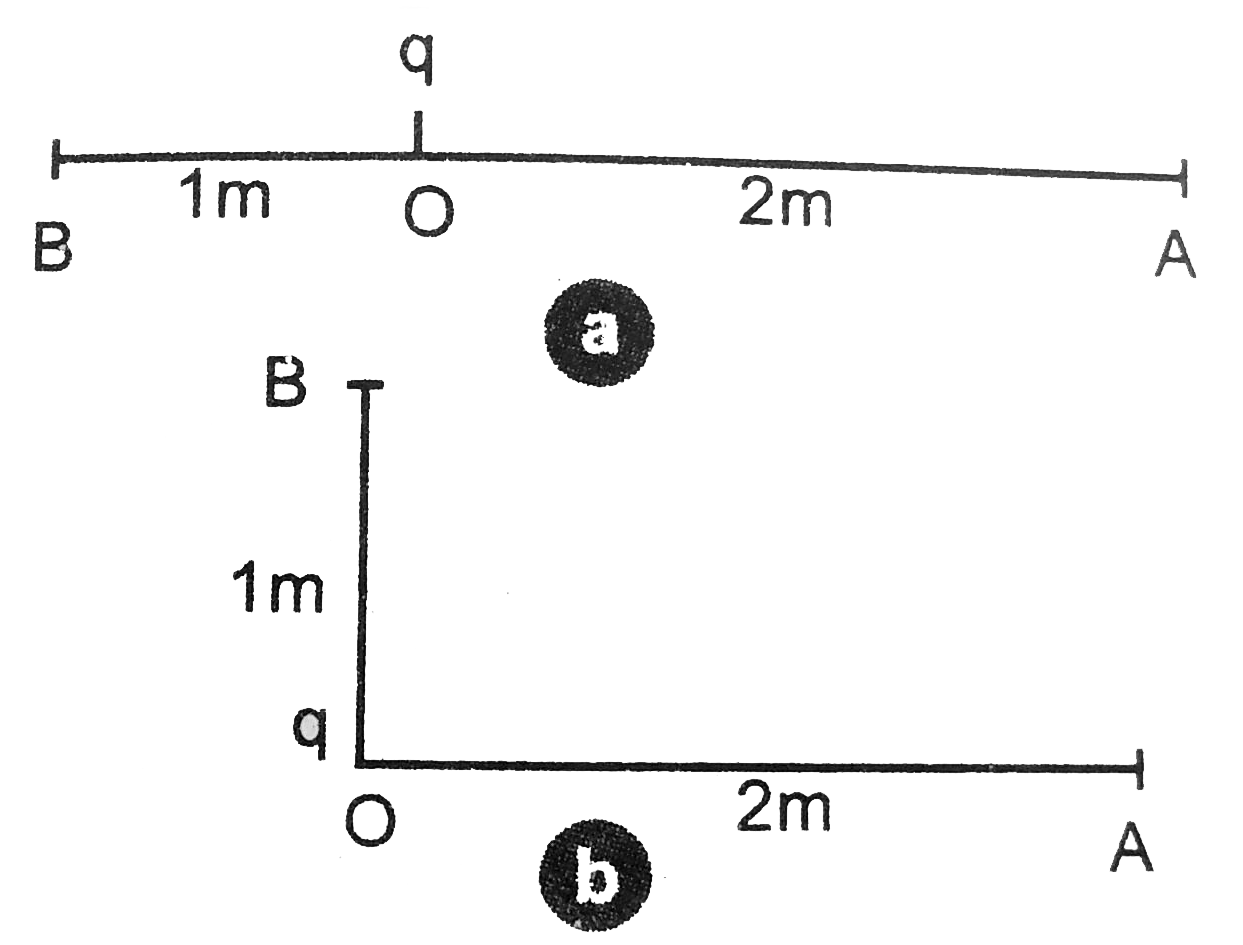
View SolutionA charge q=+1μC is held at 0 between two points A and B such that AO=2mandBO=1m Calculate the value of potential differences (VA−VB). What will be the value of potential differences (VA−VB) if position of B is charged as shown in Fig ?
View SolutionThe potential difference VA−VB for the circuit shown in fig. is. −(22/x)V. find the value of x.

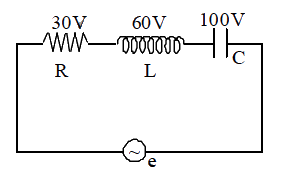
View SolutionIn the given figure, the potential difference is shown on R, L and C. The e.m.f. of source in volt is -
View SolutionThere is a series LCR curcuit (as shown). An alternating source of emf having voltage V=V0sinωt is applied between M & N.

Here VM−VN=V0sinωtand1ωC−ωL=R
R.M.S value of potential difference across capacitor will be
View Solution


