Explain the given graph :
Observe the graph below . Temperature of water is raised from 0∘C , observe the change in volume at different temperatures and explain the behavior of water .
 Solution in Tamil
(i) AS water at 0∘C is heated upto 4∘C it contracts instaead of expanding . The volume of water at 4∘C is minimum . If water at 4∘C is further heaed then it expands and its volume increases.
(iii) This expectional behaviour which water shows between 0∘C to 4∘C it contracts instead of expanding . since volume at 4∘C is minimum, hence , density is maximum.
Similar Questions
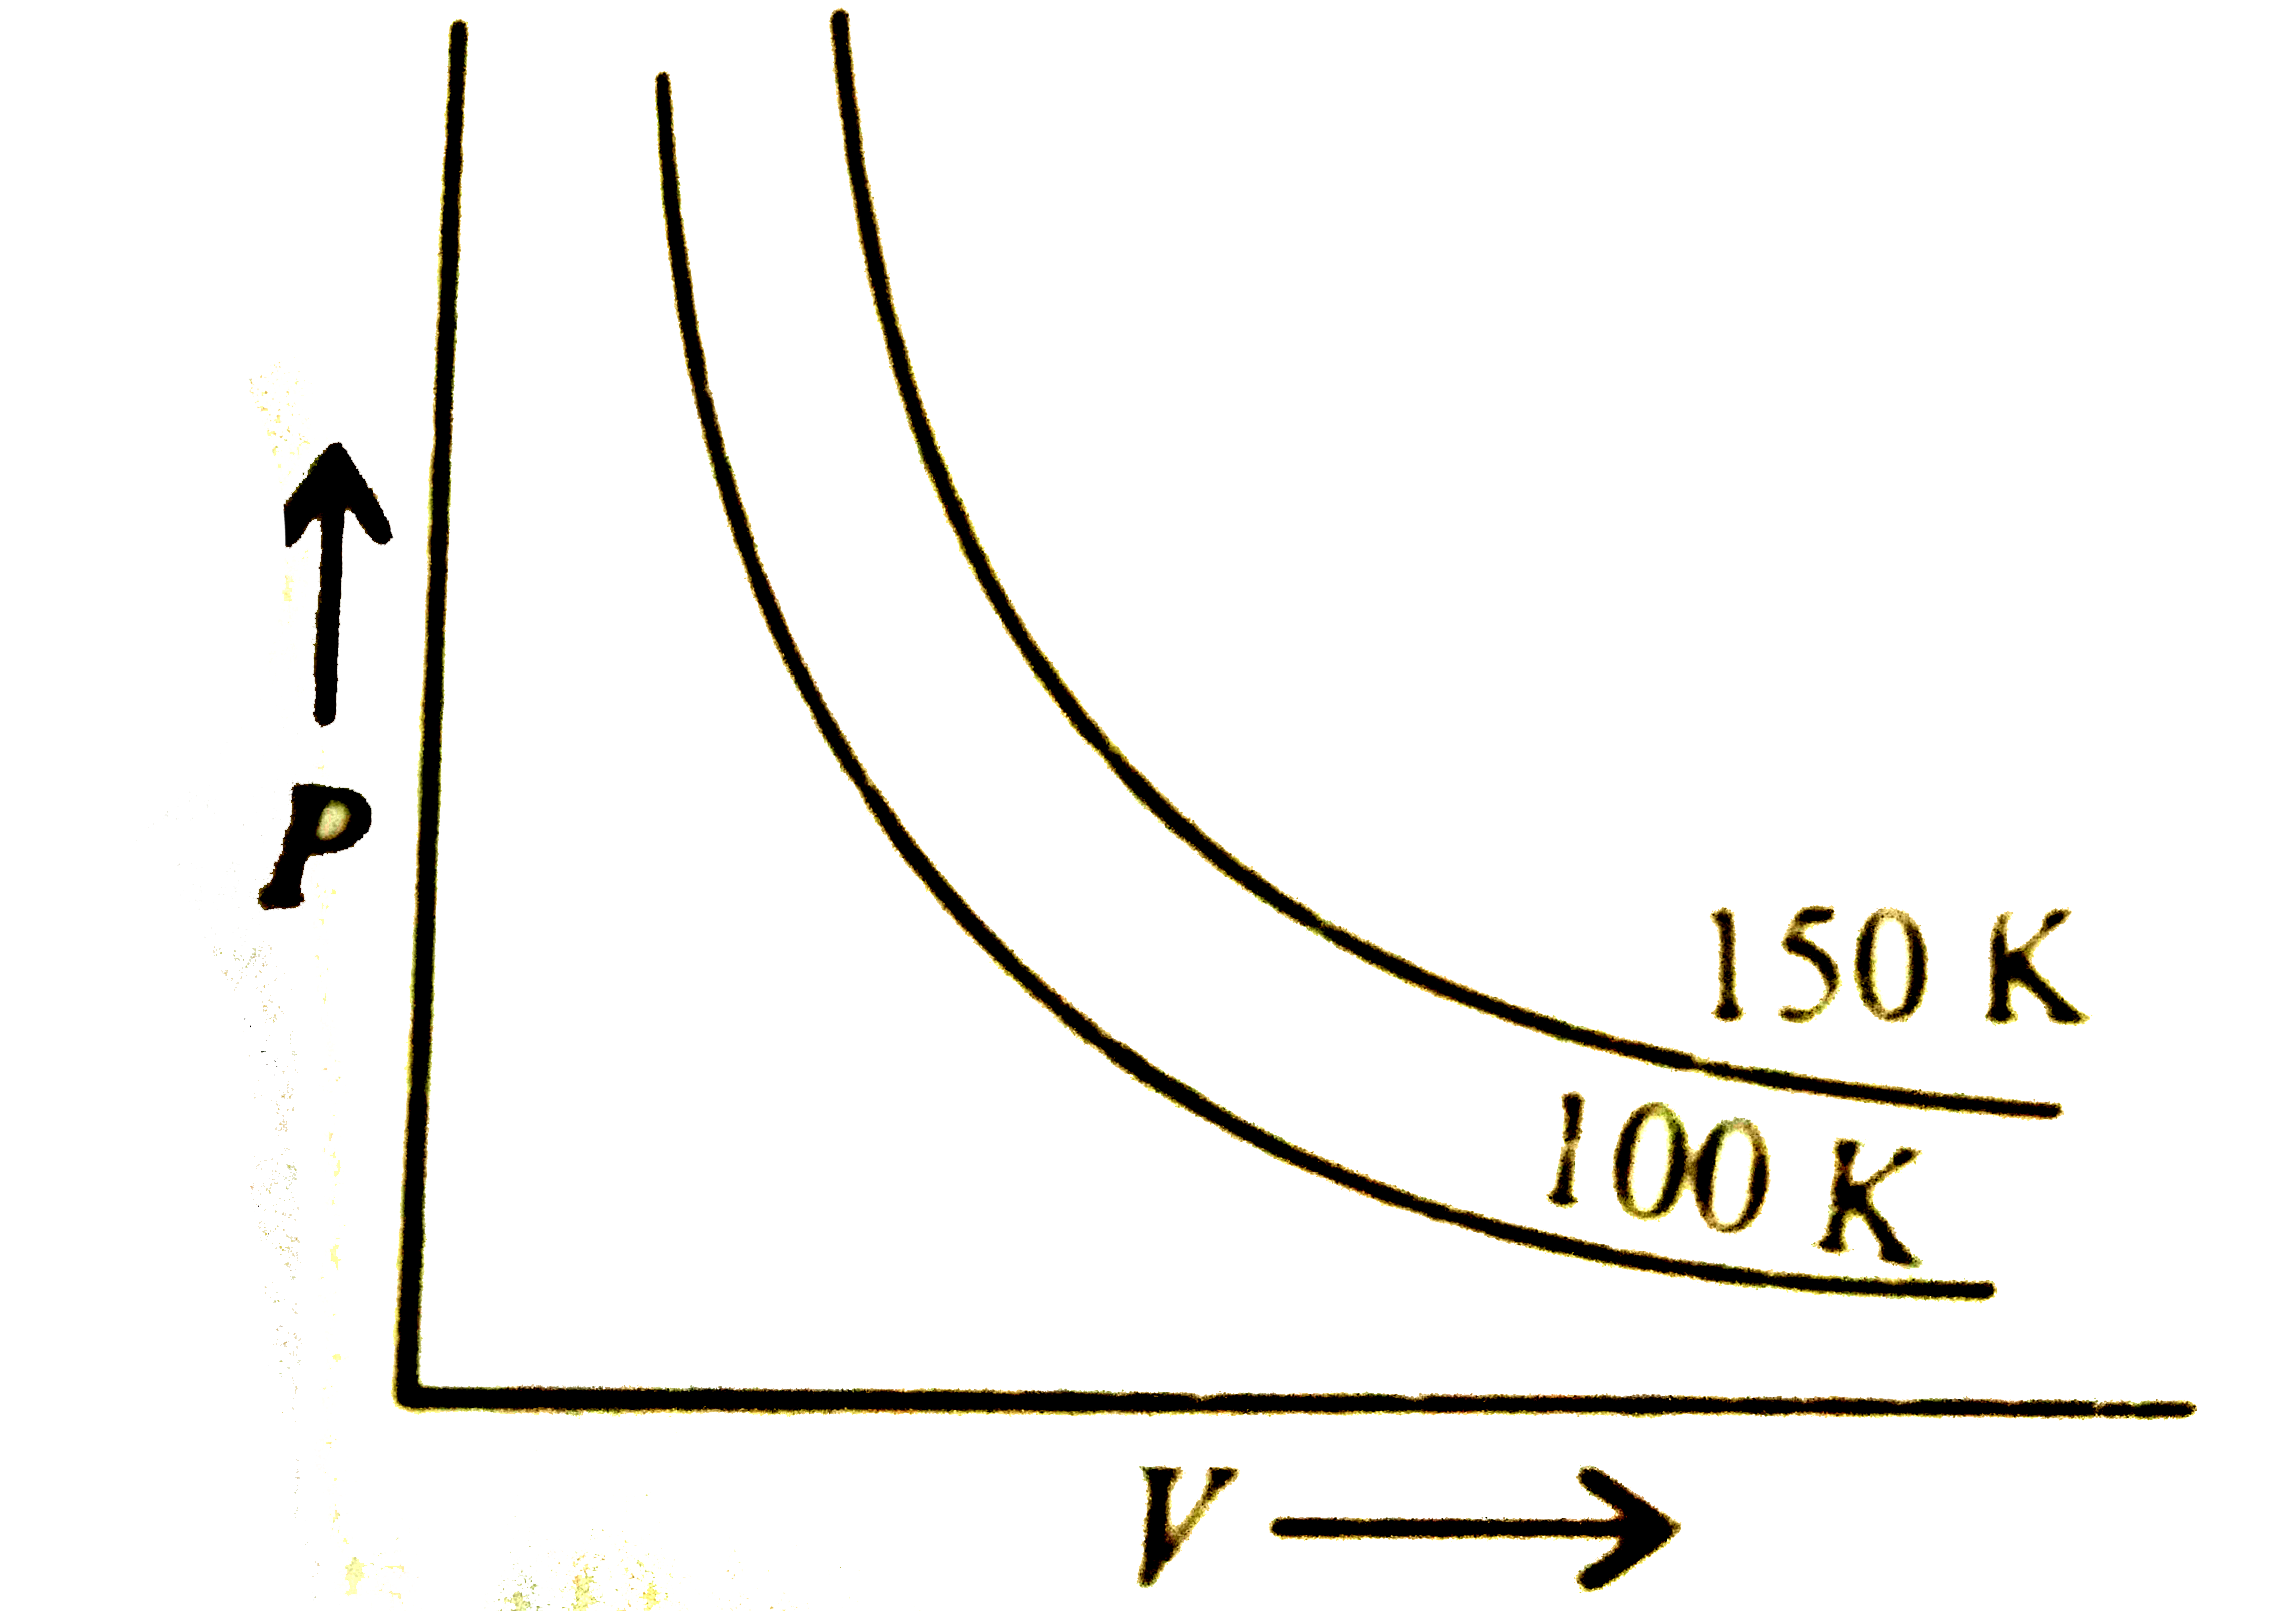
A graph is plotted between pressure and volume at different temperature. On the basis of the graph what changes will you observe in the volume if (i) the pressure is increased at constant temperature (ii) the temperature is decreased at constant pressure
View SolutionExplain the variation of temperature with heat for water at 1 atm with a graph.
View SolutionA block of wood is floating on water at 0∘C, with a certain volume V above water level. The temperature of water is slowly raised from 0∘C. How will the volume V change with the rise of temperature?
View SolutionA graph is plotted between pressure and volume at different temperatures . On the basis of the graph what changes will you observe in the volume if
(i) the pressure is increased at constant temperature .
(ii) the temperature is decreased at constant pressure .

View Solutiondraw a graph showing the variation of volume of a given mass of water with temperature from 0°C . In the graph mark the temperature at which water has maximum density.
View SolutionA block of wood is floating in water at 0∘C. The temperature of water is slowly raised from 0∘C to 10∘C. How will the precentage of volume of block above water level change with rise in temperature?
View SolutionDraw a graph showing the variation of volume of a given mass of water with temperature from 0∘C . In the graph mark the temperature at which water has maximum density.
View SolutionState the volume changes observed when a givenmass of water is heated from 0^(@)C to 10^(@)C . Sketch a temperature volume graph to show the behaviour.
View Solution
