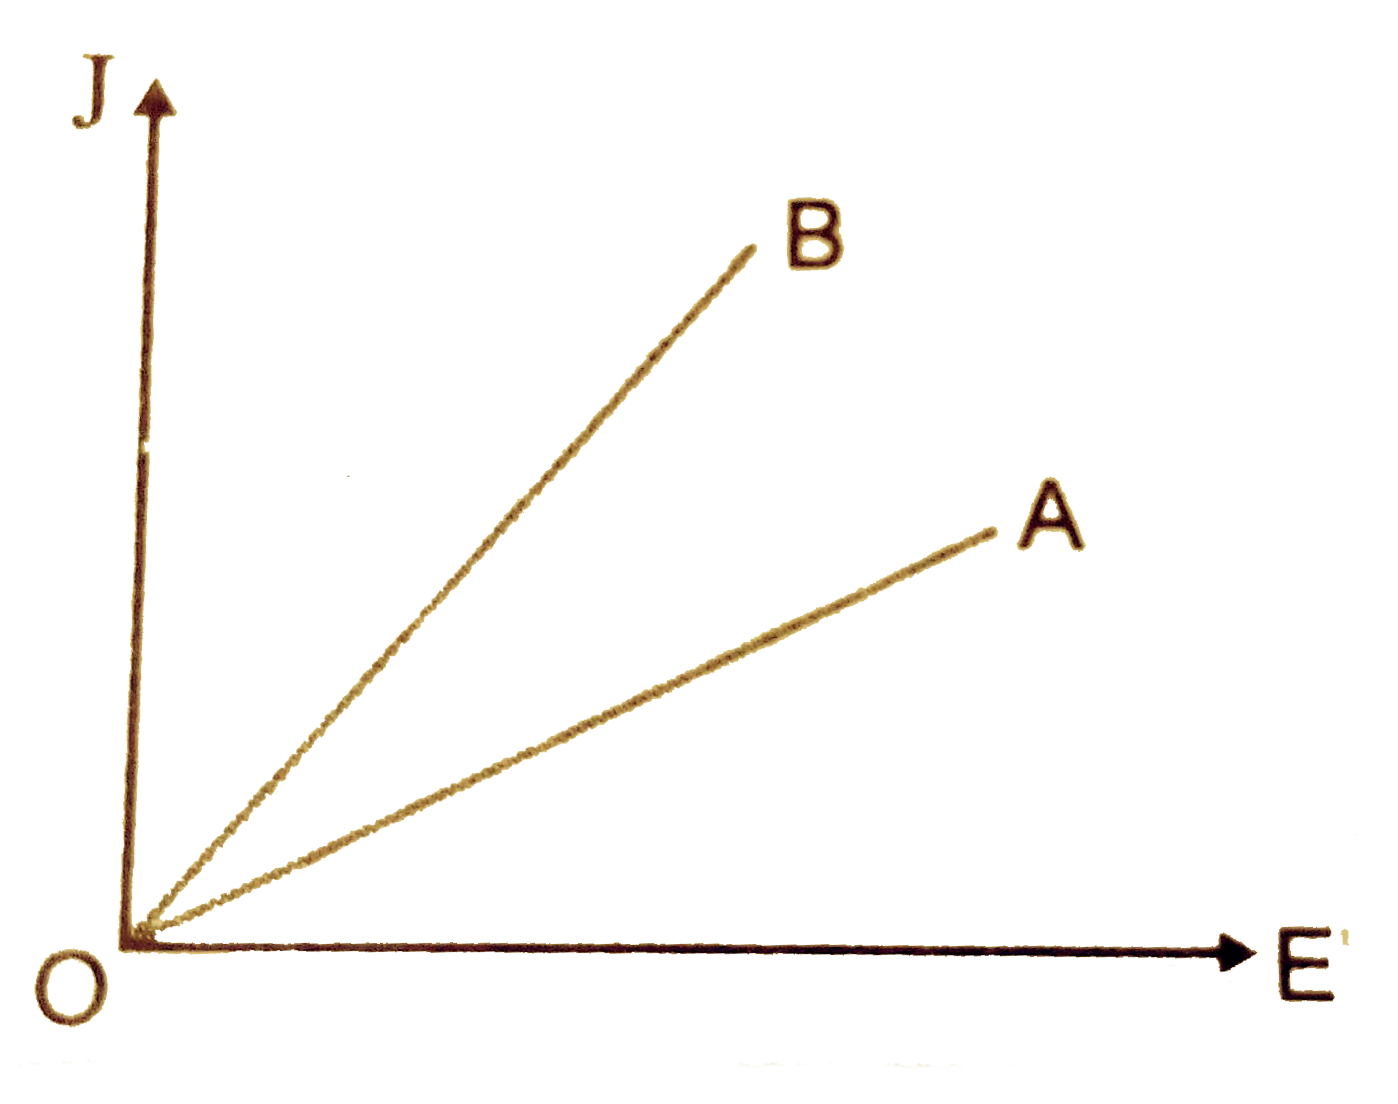
Plot a graph showing the variation of current density (J) versus the electric field ( E ) For two conductors of different materials. What information from this plot regarding the properties of the conducting material, can be obtained which can be used to select suitable materials for use in making (i ) standard resistance and (ii) connecting wires in electric circuit?
We know that J=σE or σ=J/E
where σ is the electrical condutivity of the conductor.
The variation of current density ( J) versus the electric field (E ) for two conductors A and B is shown in figure.
Here, the slope of each st. line tells the conductivity of that material.
From graph, σB>σA.
We know that electrical resistivity (ρ) is reciprocal of electrical conductivity.
∴ρAρB=σBσA>1orρA>ρB
The material to be used in making a standard resistance, we require that the resistance of the given conducting wire is large. It will be so if its resistivity is large and its conductivity is small. Therefore, the material A is used in making the standard resistance.
The material to be used in making a connecting wire, we require that the resistance of the given connecting wire is small. It will be so if its resistivity is small and the conductivity is large. Therefore the material B is used in making a connecting wire is the circuit.

Similar Questions
State Joule's law of heating by electric current. Name the materials used to making (i) standard resistors (ii) heater element.
View SolutionPlot a graph showing variation of current versus voltage for the material Ga.
View SolutionFor making standard resistance wire of following material is used
View SolutionThe current density in a wire is 10A//cm^(2) and the electric field in the wire is 5 V/cm. If p = resistivity of material, sigma = conductivity of the material then (in SI unit)
View SolutionName two materials that can conduct electricity.
View SolutionElectrical conductors are used to cover materials that carry electricity.
View SolutionUsing Einstein's photoelectric equation show how the cut -off voltage and threshold frequency for a given photosensitive material can be determined with the help of a suitable plot/graph.
View SolutionDefine resistivity of a conductor. Plot a graph showing the variation of resistivity with temperature for a metallic conductor. How does one explain such a behaviour, using the mathematical expression of the resistivity of a material
View Solution

