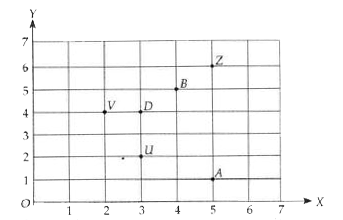
In the above graph, point B indicates
A
Breaking point
B
Limiting Pooint
C
Yield point
D
Elastic limit
Video Solution
Text Solution
The correct Answer is:C
|
Answer
Step by step video, text & image solution for In the above graph, point B indicates by Physics experts to help you in doubts & scoring excellent marks in Class 11 exams.
Updated on:21/07/2023Similar Questions
Knowledge Check
In the above graph, point D indicates
ALimiting PoointBYield pointCBreaking pointDElastic limit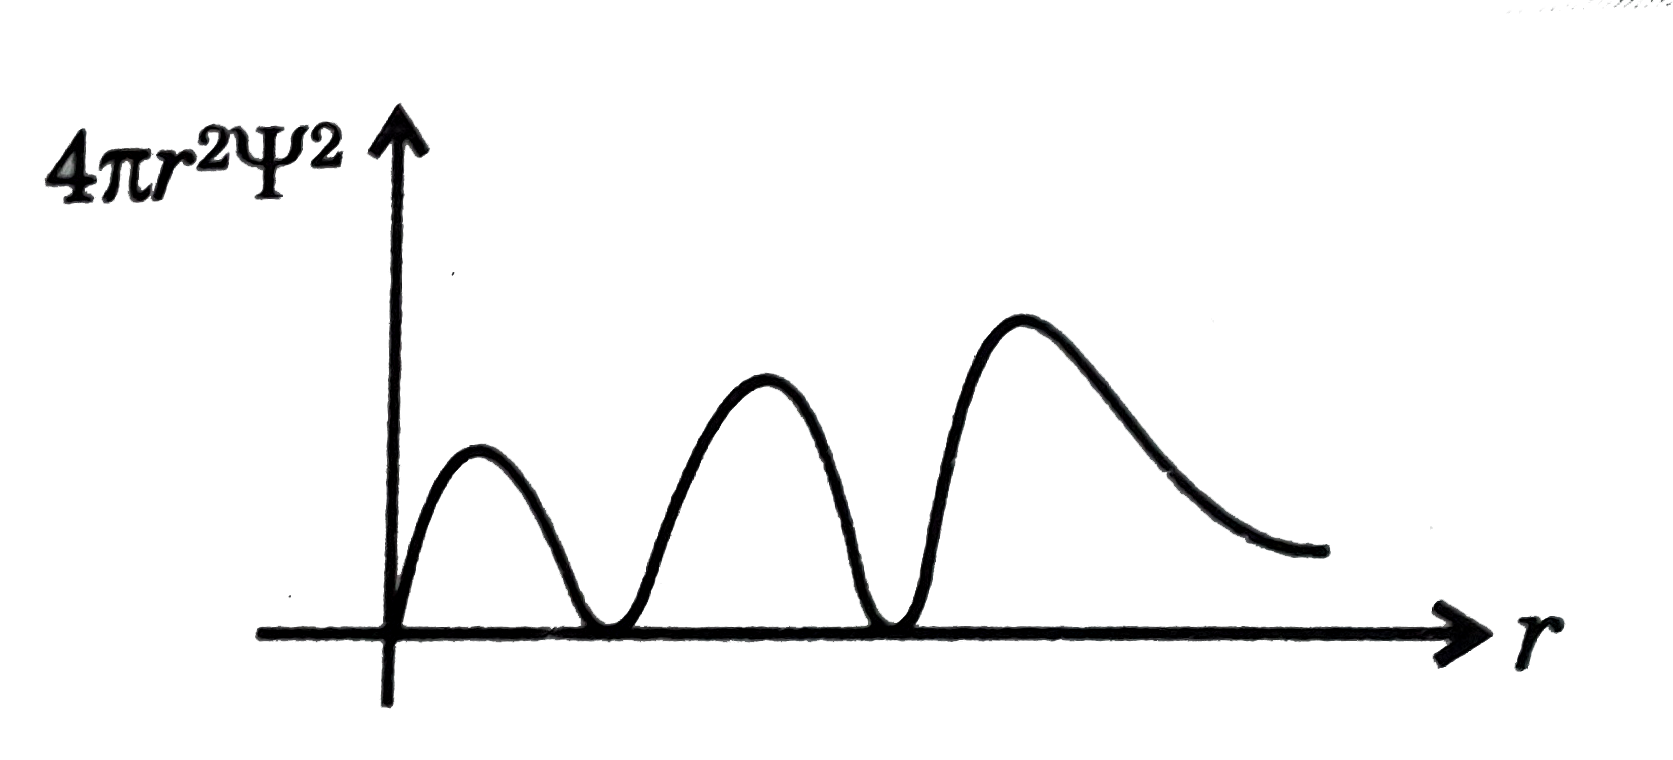
The above graph cannot be of:A3sB4pxC3pxD5dxy
In above graph element F is:AoxygenBnitrogenCfluorineDneon
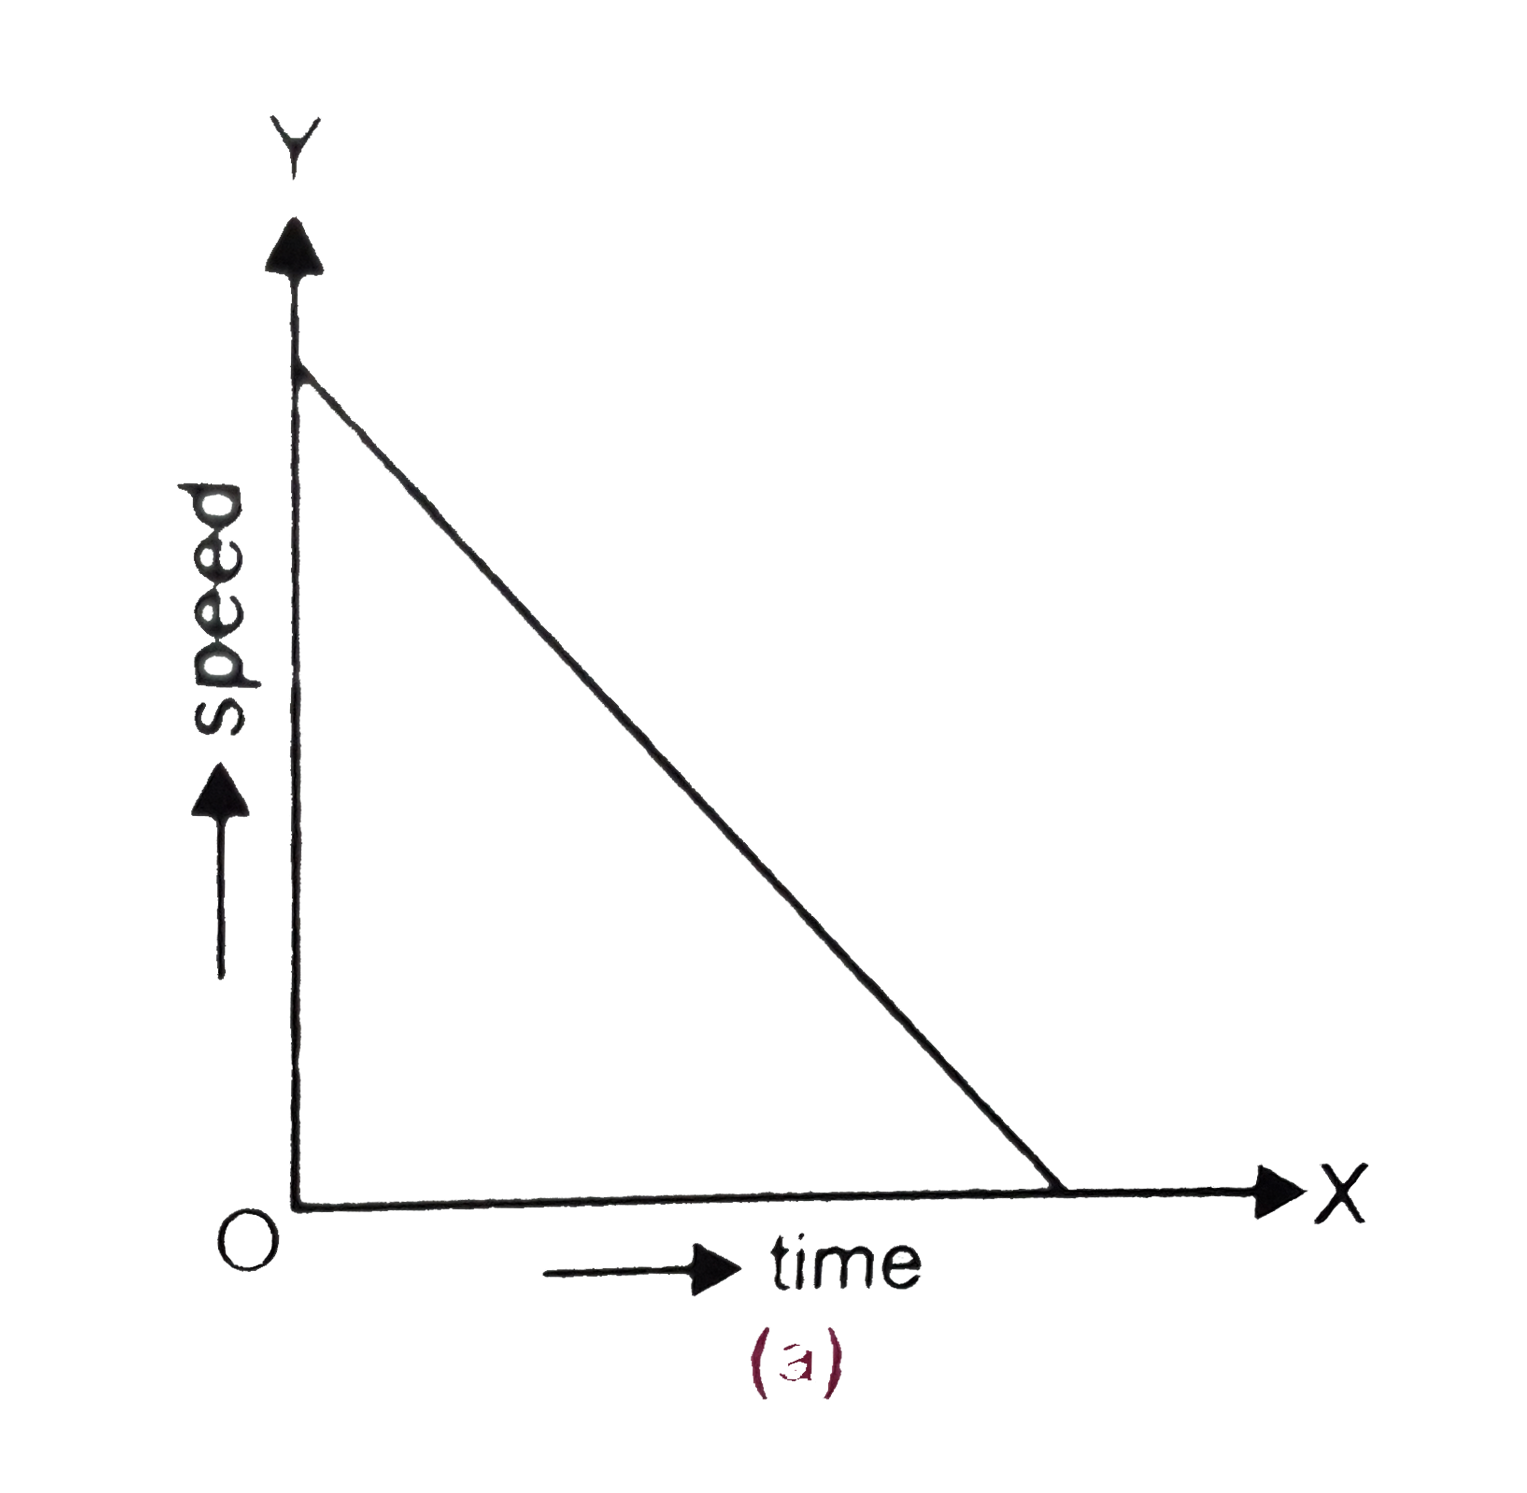
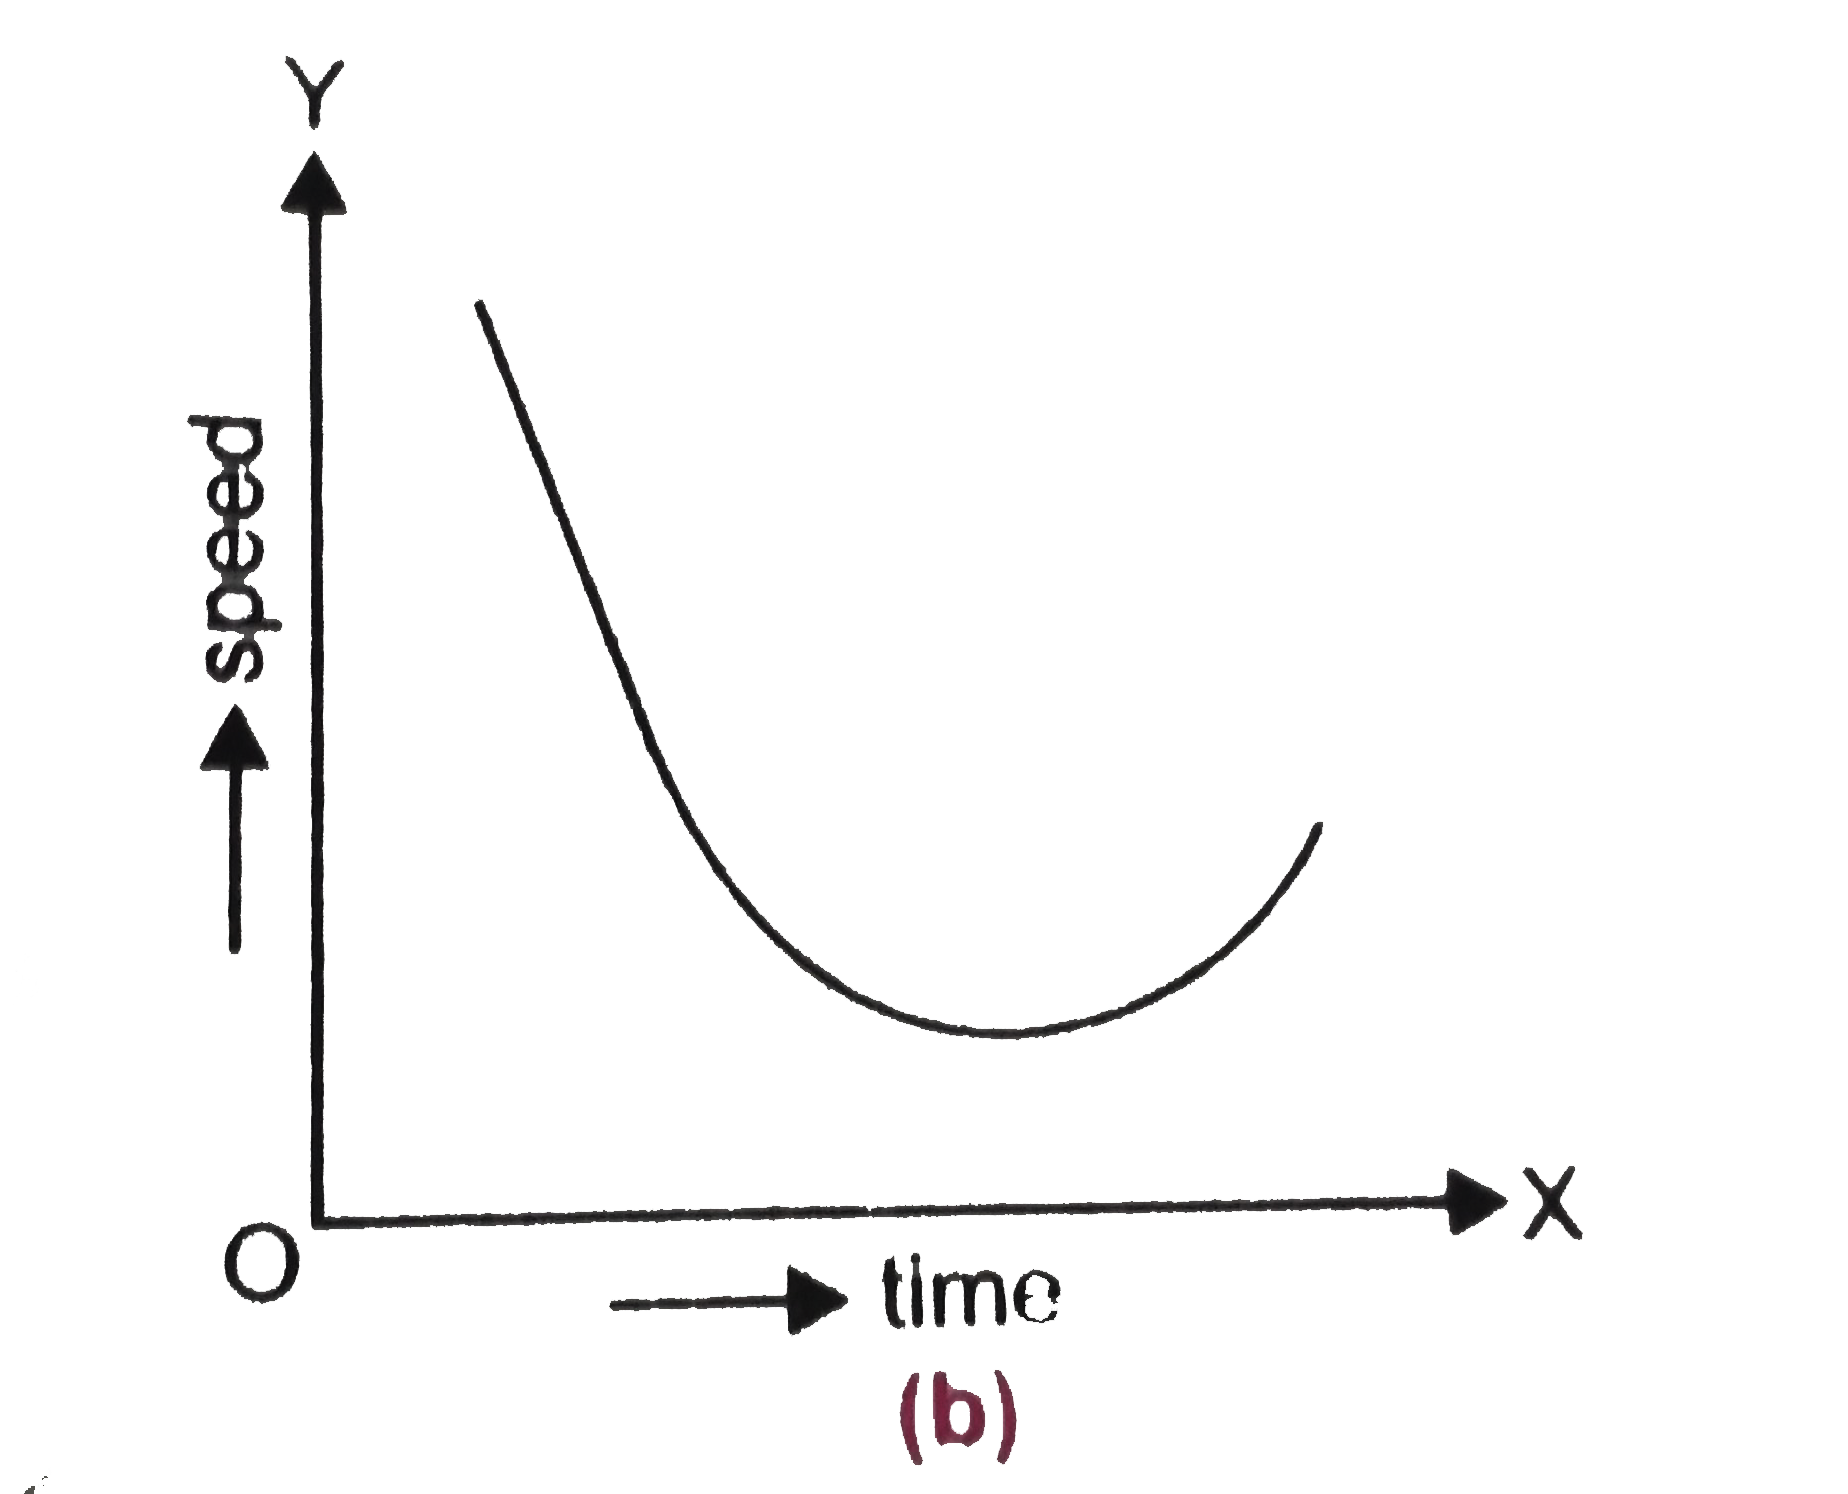
What do the graph shown in Figure indicate ?
View Solution.
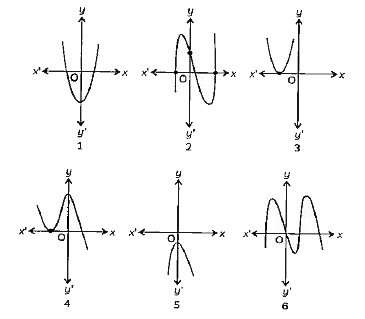
Which of the above graph represent quadratic polynomials?
View Solution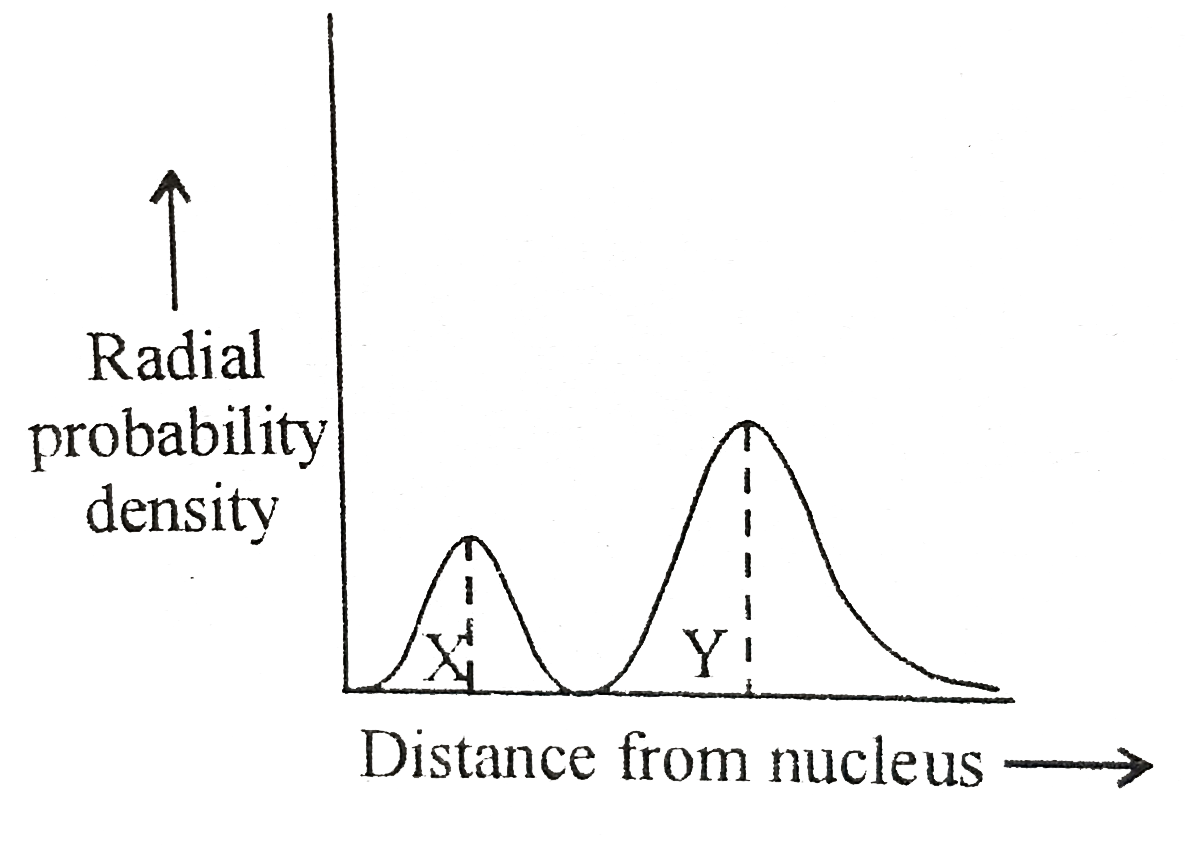
If the above radial probaility curve indicates '2s' orbital, the distance between the peak points X& Y
is
View SolutionThe Δ sign written above the arrow indicates ……………of the reactions.
View SolutionThe Δ sign written above the arrow indicates …………..of the reaction
View Solution


